April 30, 2025
User Management: Bulk User Management (Beta)
|
|
Feature Update:
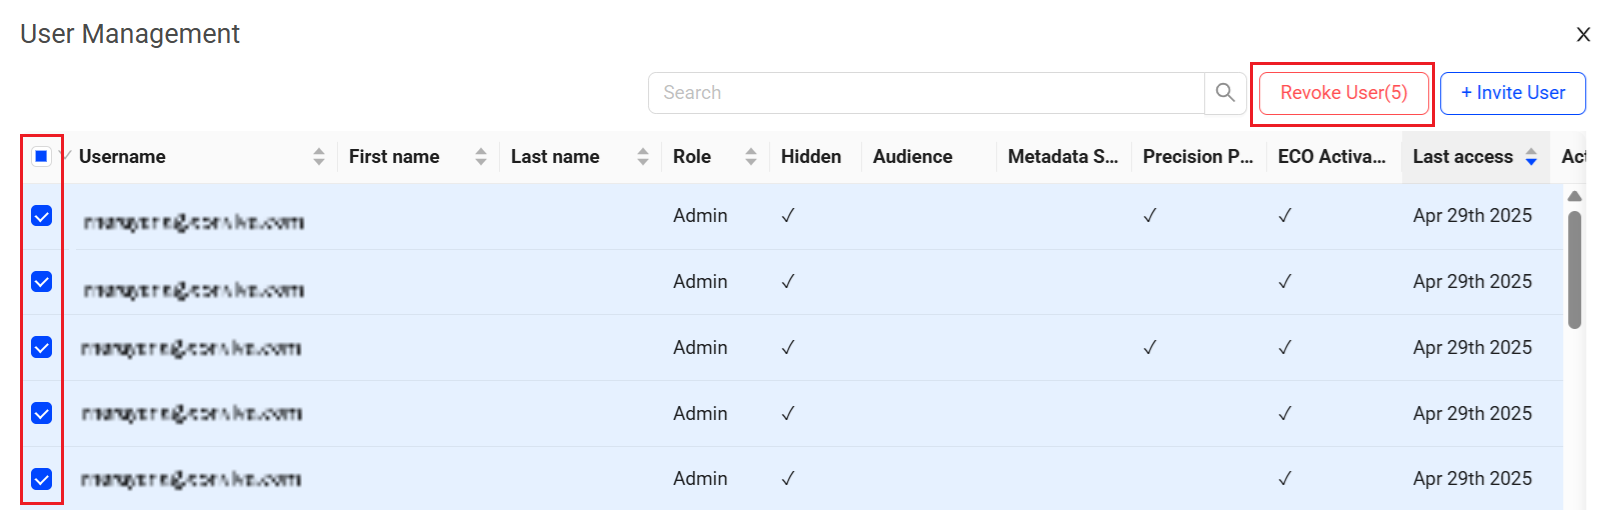
Introduces a new User Management dashboard with options for admins to perform bulk user updates, such as inviting groups of new users, assigning and editing user roles, updating user profiles, setting access permissions, and monitoring user activities. Admins can also apply permissions to multiple users for ECO Activation Admin, Precision Policy Admin, Metadata Service, and Audience settings.
Click to expand the image

Use Case:
Admins can easily select multiple users for admin actions, such as revoking user access, streamlining user management operations.
More Details: Bulk User Management (Beta).
April 24, 2025
-
Flow and Metric Builder: Improved Activation Workflows for Flows and Metrics
-
Trends: Extend Secondary Filters option to Duration Custom and Flow Metrics
Flow and Metric Builder: Improved Activation Workflows for Flows and Metrics
|
|
Feature Update:
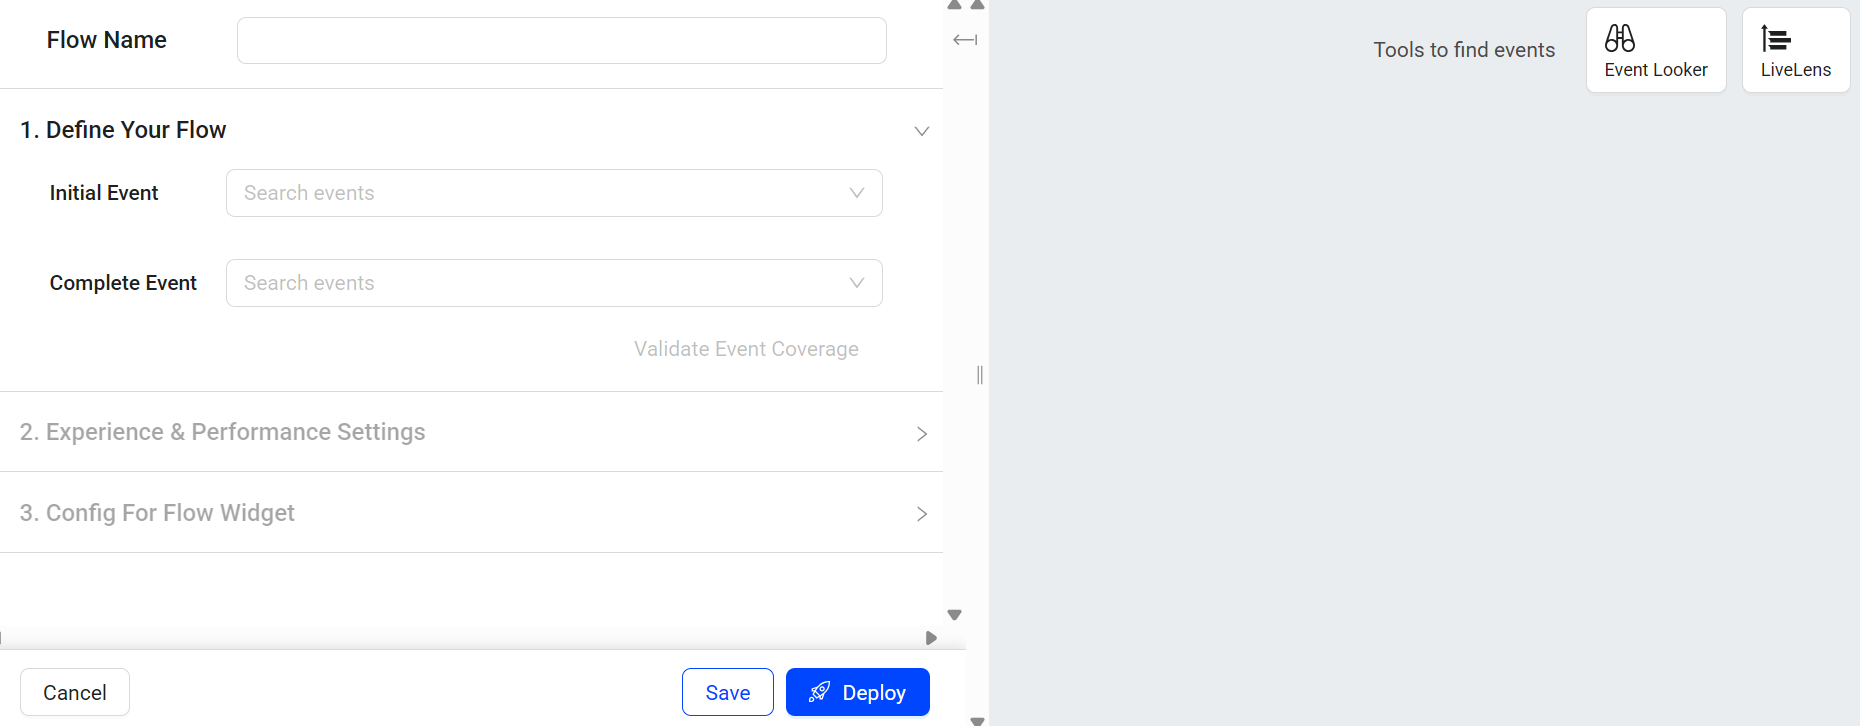
Introduces redesigned UIs and workflows for building and activating Flows and Custom Metrics. The update streamlines event mapping, improves rule visibility, and enables more efficient creation and modification of flows and metrics.
Click to expand the image

Use Case:
When creating flow and custom metrics, map events not only from Event Looker using event metadata, but also from LiveLens by selecting events and their metadata directly from the timeline view.
More Details: Metric Builder.
Trends: Extend Secondary Filters option to Duration Custom Metrics and Flow Metrics
|
|
Feature Update:
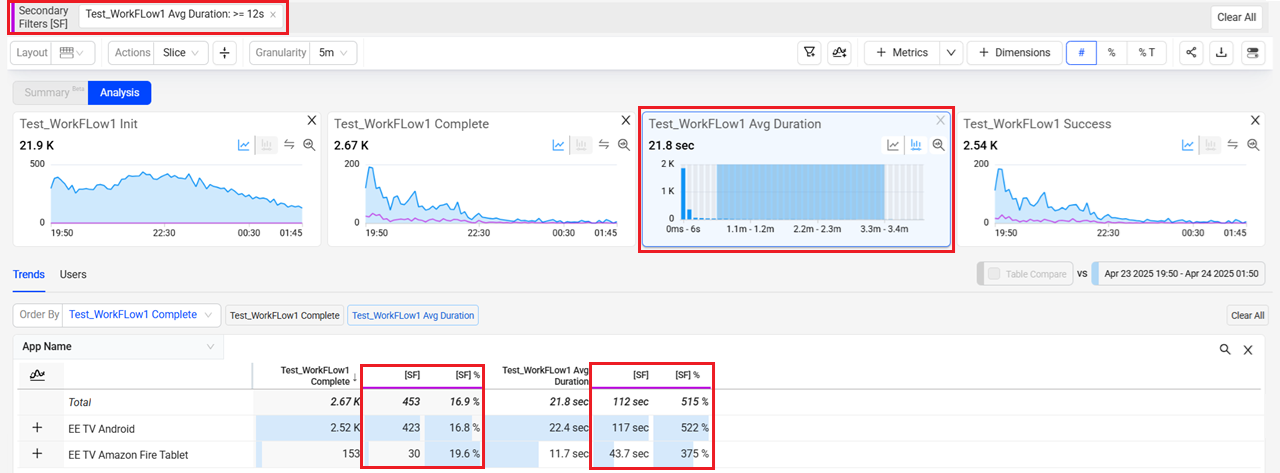
Applies secondary filter functionality to the duration custom metrics and average duration flow metrics. Use the selected distribution range as a page-level filter across the dashboard. Overlay a purple line on the time series view and insert two additional columns in the dimension table view. The dashboard shows primary filter details in blue, while the secondary filter appears as a pink overlay on the time series. An additional column shows the details of the secondary filter.
Click to expand the image

Use Case:
To analyze the average login flow duration for the EE TV Amazon Fire Tablet app, set it as the primary filter. Then, click the distribution icon next to the Flow Avg Duration metric and choose a range from the distribution view to apply a secondary filter. In this example, selecting a duration greater than 12 seconds applies a secondary filter, allowing a comparison of the success rate between the overall app and the subset with the selected duration. The secondary filter enables precise analysis of the impact of flow durations on flow outcome metrics, such as 'success'.
More Details: Applying Metric Filters for Deeper Analysis in the Basics and Tasks tab
April 17, 2025
- Flow Analysis: Associate Network Request with Flows
- Trends Flow Widgets: New Business Metrics
- Flow Builder: New Checkbox to Keep or Remove Historical Data When Updating Flows
- Flow Specific Dashboard: Break Down Flow Errors by Custom Error and Event Dimensions
Flow Analysis: Associate Network Request with Flows
|
|
Feature Update:
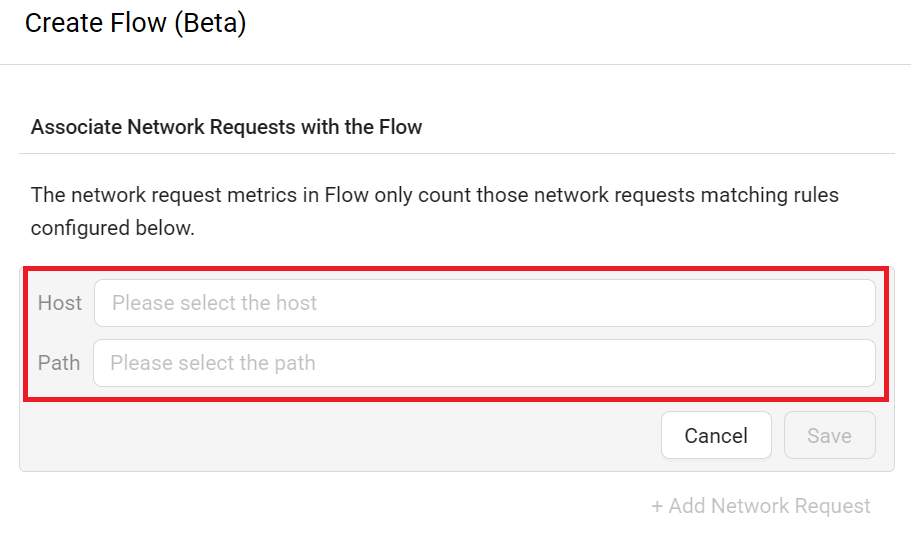
Enables network requests associated with Flows based on a list of rules defined by Host and Path, allowing you to pinpoint services or APIs that impact flow conversion.
Use Case:
To pinpoint services or APIs that impact Flows' conversion, analyze the network request durations and network request failures after enabling network requests associated with Flows.
More Details: Metric Builder.
Trends Flow Widgets: New Business Metrics
|
|
Feature Update:
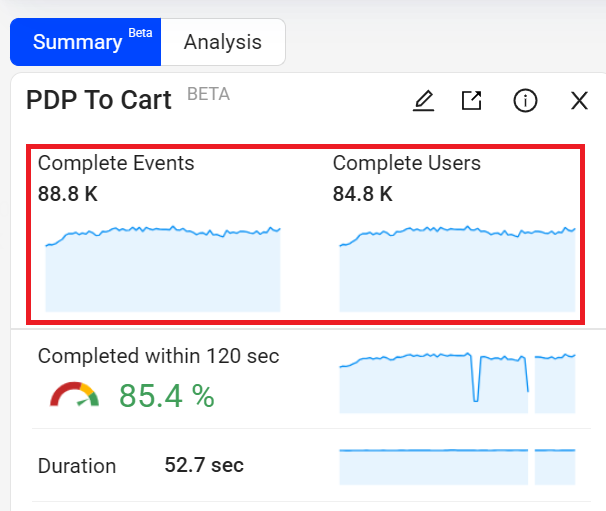
Adds two business metrics, which are independent of any flow constraints, to the Flow Widget. These metrics simply count how many times the event occurred and how many users completed the event.
Use Case:
To better understand how many complete events occur independently, for example, how many times a payment occurs, regardless of the initial event in the flow or the conversion time, check the Complete Events metric from the Flow Widget.
More Details: Flow Widget.
Flow Builder: New Checkbox to Keep or Remove Historical Data When Updating Flows
|
|
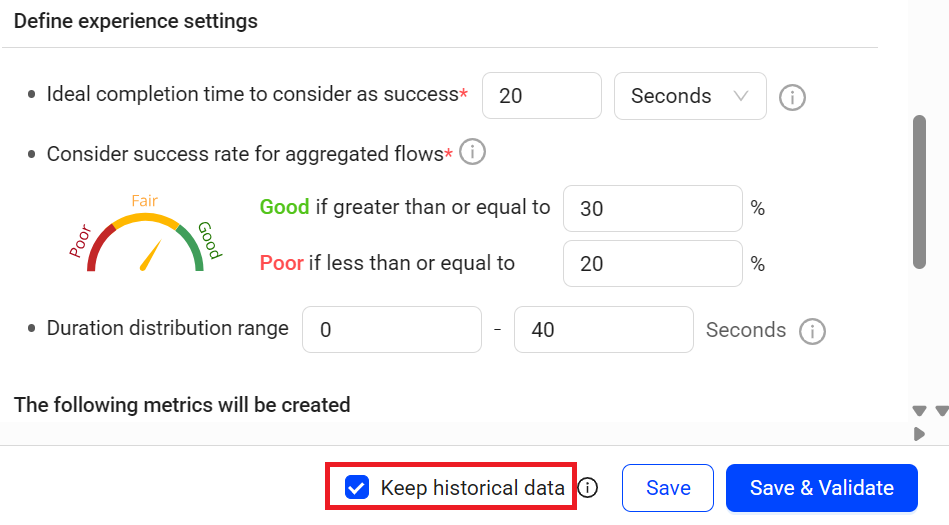
Feature Update:
Adds a Keep historical data checkbox when editing the flow, enabling control over historical data persistence when flow settings change. This enhancement controls whether historical data is maintained across flow setting changes, allowing complete data refresh for major changes and persistent data for minor updates.
Note: By default, the Keep historical data checkbox is selected.
Click to expand the image

Use Case:
Preserves historical flow data for most setting updates, enabling flow adjustments based on trend analysis and performance tracking over time. The setting is especially beneficial during the initial flow setup phase as iterations with different settings can help refine flow definitions.
More Details: Metric Builder.
Flow Specific Dashboard: Break Down Flow Errors by Custom Error and Event Dimensions
|
|
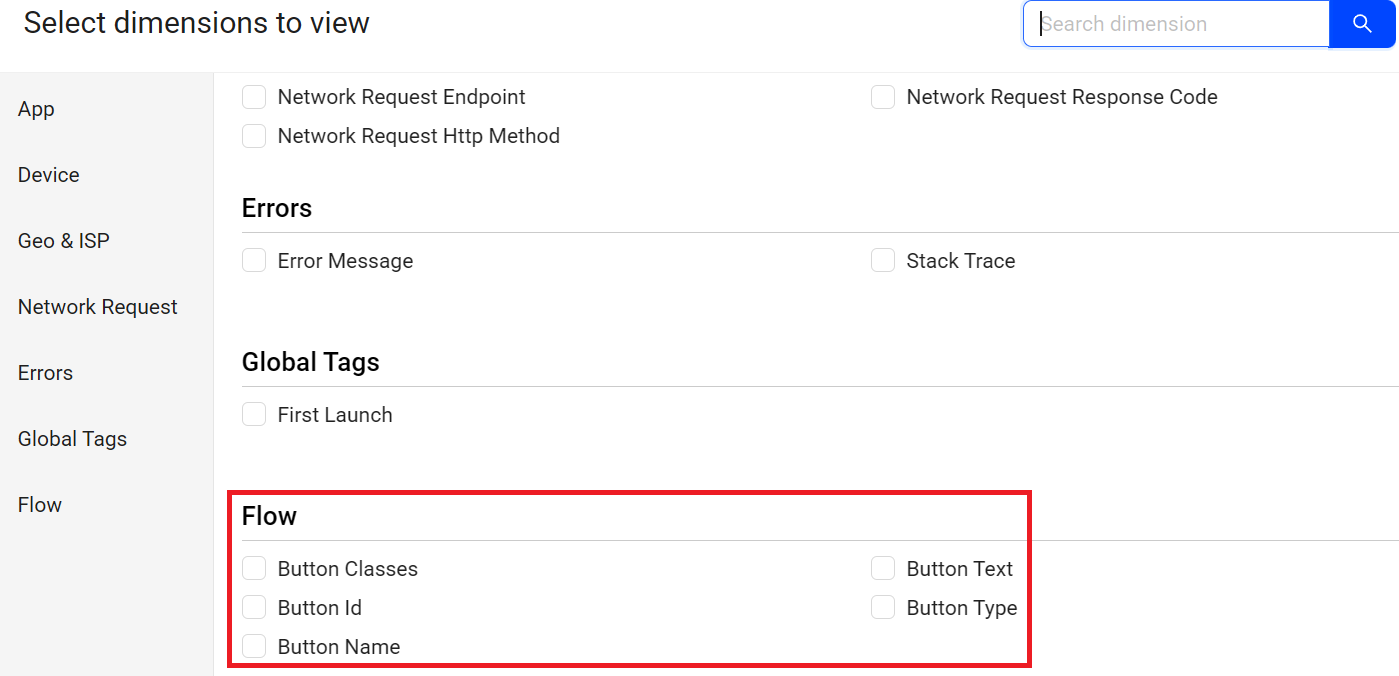
Feature Update:
Enables the flow errors analysis drill-downs with both custom error dimensions and flow event dimensions. This enhancement allows deeper and more actionable insights into where and why flow errors occurred.
Click to expand the image

Use Case:
Better understand the context of flow errors by using custom error dimensions and flow event dimensions for the Flow Specific Dashboard. For example, when errors occur, identify which product ID is most impacted.
More Details: Flow Widget.
April 10, 2025
Trends Summary Widgets: New limit of 10 Widgets
|
|
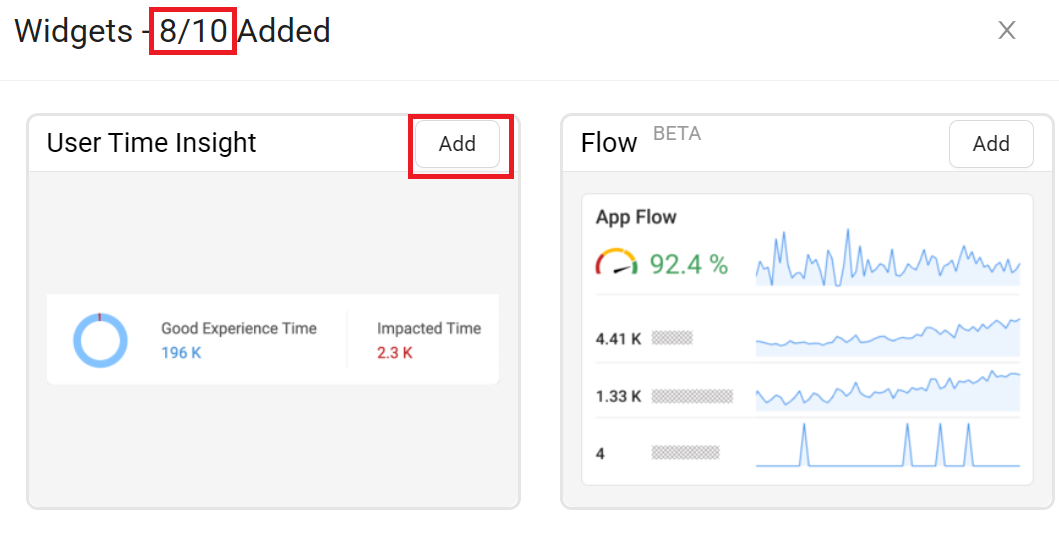
Feature Update:
Includes a new widget counter on the Summary Widget screen that displays the total number of widgets added to the Summary tab. This feature tracks the widget usage against the ten-widget limit to help users monitor available slots in the tab.
Click to expand the image

More Details: Summary Tab.
Trends Flow Widget: New Info Icon for Flow Details
|
|
Feature Update:
Updates the Trends Flow Widget with access to flow details, making it easy to check flow details within Trends.
Click to expand the image
![]()
Use Case:
To quickly confirm the event composition of a flow in a Flow Widget in Trends, click the information icon to verify the initial and complete event selections. For additional flow information, click the flow name to open the Activation flow detail page, which displays the flow details, such as the duration distribution range.
More Details: Flow Widget.
Trends: New Metrics Categories
|
|
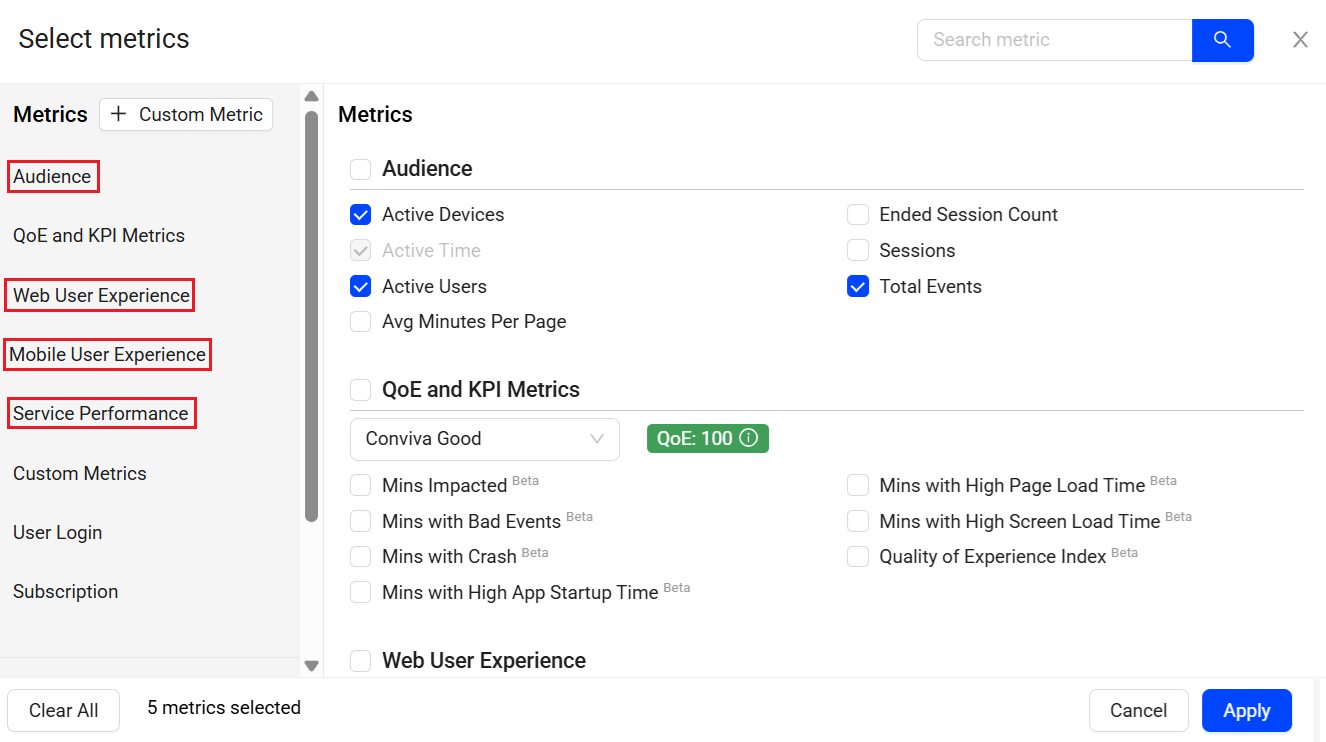
Feature Update:
Enhances the metrics in Trends and Real-Time by introducing new categories: Audience, Web User Experience, Mobile User Experience, and Service Performance metrics. This categorization presents the ECO values in a more structured format and simplifies user selection to quickly focus performance analysis on specific audiences, user platforms, and service impacts.
Click to expand the image

More Details: ECO Metrics.
Metric Creation: New Option in Pairing Logic
|
|
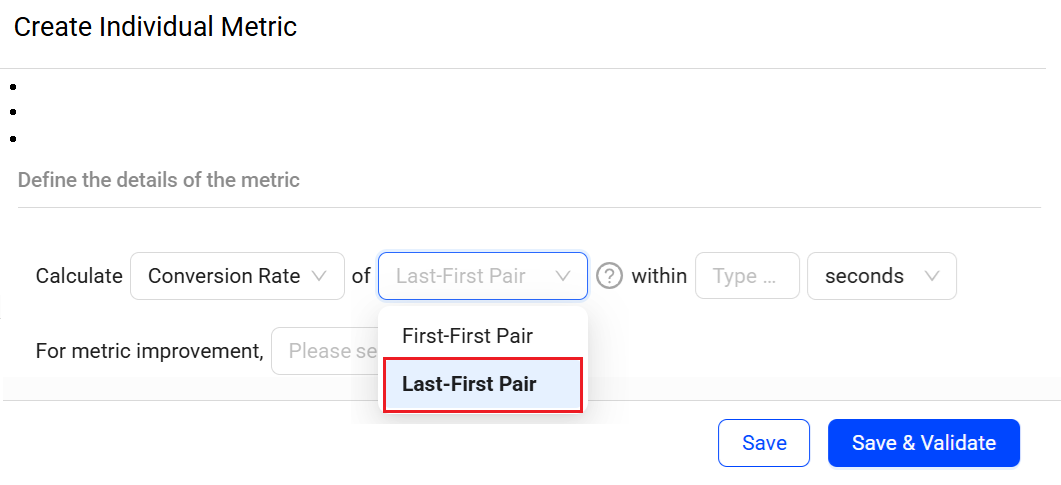
Feature Update:
Enables the creation of conversion metrics that count a conversion as successful when the last initial event pairs with the first follow-up event within the specified time frame.
Click to expand the image

Use Case:
The Tracking conversion from Payment Submit to Payment Success uses the First-First model to count conversions from the initial payment attempt, assuming the first attempt ideally results in a successful payment. At the same time, tracking conversion from Search Submit to Video Play uses the Last-First model to count conversions from the last search, which provides a satisfactory result and leads to a video play.
More Details:Metric Builder.