Custom metrics are associated with specified initial/follow-up events to analyze data for complex user actions and app performance scenarios, such as analyzing the amount of time spent between viewer login and the start of video playtime, and the success rate of cart uploads to completed purchase.
DPI enables different types of individual metrics. Start mapping from a Conviva predefined event, a custom event, or a combination of both as mapping rules to comprehensively track the desired user behavior.
-
Duration Metric: Measures the time interval between two events, such as the duration between the login screen event and the login success event to measure login durations and quickly respond to impacting login issues.
-
Conversion Metric: Measures the count or conversion rates of events from one stage to another, such as the count of sessions with successful login after opening the login screen to measure the successful login conversion and find highlights to improve user experience.
-
Event Aggregation Metric: Measures the number of events, or calculates the value of event attributes, such as the average duration of network requests to measure the network request performance and do optimization accordingly.
-
Ratio Metric: Displays the relationships or proportions using mapped event values and OOB/custom aggregation metric values, such as revenue per paying user.
For this metric, select the Ratio metric settings with:
-
Numerator: build from a mapped event, such as Total Revenue, calculated by total values
-
Denominator: build from the predefined metric Unique Users
For detailed analysis, applying this metric to a dimension in Trends, such as Device, shows how revenue per paying user varies across different device types.
-
Creating Custom Metrics
-
Start with the location:
-
Activation Home Page
-
Metric Builder
-
Select metric page in Trends
-
-
Enter the metric name, and provide the metric information.
-
(Optional) Metric description.
-
From the Metric Type list, select the desired metric type.
-
Conversion Metric: Measures the count or conversion rates between eventsr, such as the count of sessions with successful login after opening the login screen to measure the successful login conversion and find highlights to improve user experience.
-
Duration Metric: Measures the time interval between two events, such as the duration between the login screen event and the login success event to measure login durations and quickly respond to impacting login issues.
-
Event Aggregate Metric: Measures the number of events, or calculates the value of event attributes, such as the average duration of network requests, such as the average duration of network requests to measure the network request performance and do optimization accordingly.
-
-
-
Identify which events to select:
 Check Predefined Events
Predefined events include Conviva predefined events and events that are already mapped. Creating custom metrics based on these predefined events can often save time.
Check the predefined events from the drop-down list for event selection. For example, to analyze the registration process and identify bottlenecks, review the predefined events in the drop-down list. Look for events that indicate the start of registration and successful completion.
For the details of Conviva predefined events, check Out-of-Box Events.
Note: To update predefined events, clone them first, then configure the tag keys and values.
Discover New Events with EventLooker and LiveLens
In most cases, predefined events may not fully meet metric creation requirements. Need to map the required events and create metrics based on the newly mapped events.
Use the tools to check raw events and map the events for requirement:
-
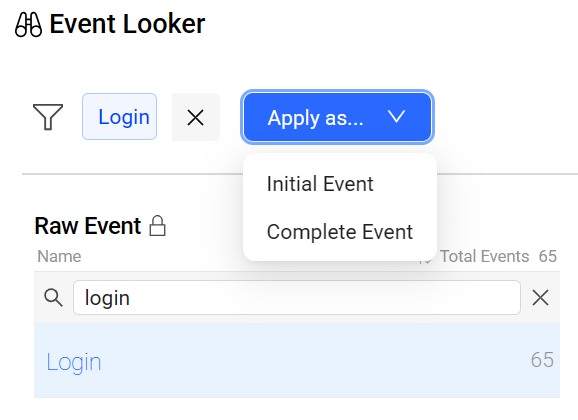
EventLooker: Allows browsing and searching events and tag keys. Use the drop-down list to apply a selected event.
-
LiveLens: Provides real-time event names and tags while interacting with an application. To learn how to use LiveLens, see LiveLens.
-
-
Select the events based on the Metric Type selection and configure metric details based on the selected metric type.
For Conversion metrics
-
Select events:
-
Initial Event: This refers to the initial event as defined previously.
-
Complete Event: This refers to the follow-up event as defined previously.
For example, to measure the conversion rate from login start to successful login, select Login Process Start and Login Success.
-
-
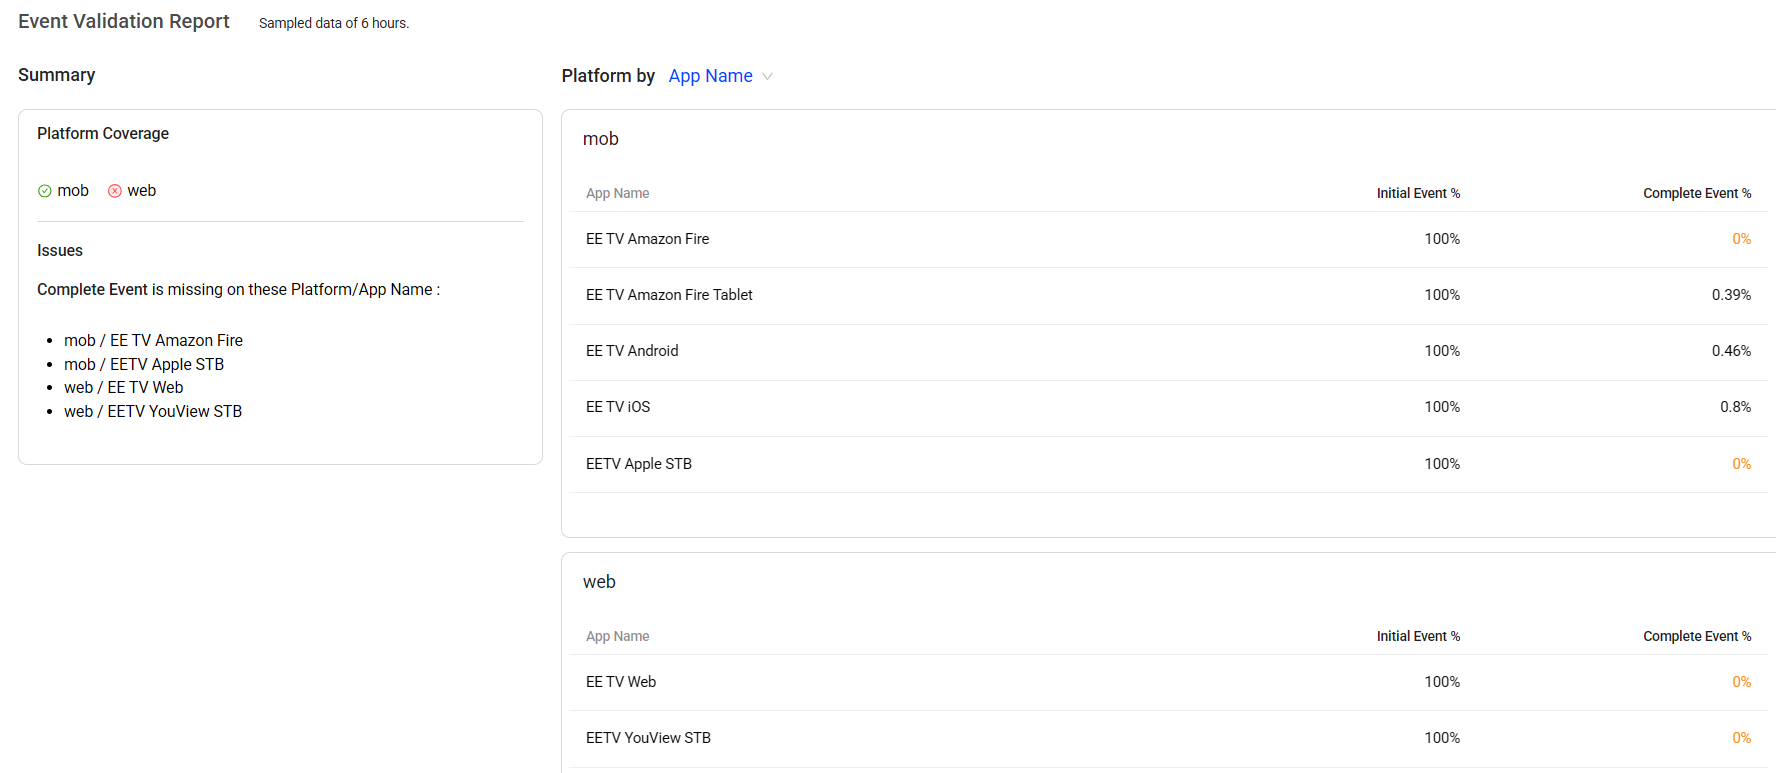
Use the Event Validation Report to confirm whether the configured events have coverage across the required integrated platforms. Deploy any required uncovered events in Semantic Mapper.
For example, if the Validate Report shows that a selected event for Login Success is missing from the Web platform, use Semantic Mapper to map and deploy that event, so the Login Success metric includes the related activities of Web users.
-
Configure metric details:
-
Select the conversion type, Conversion Rate or Conversion Count.
-
Set a criteria for the desired conversion window (or time boundary/constraint) for the paired events’ occurrence per pairing logic for the fields of Calculate Conversion Rate / Conversion Count of successful conversions within a given seconds/minutes/hours.
As the same events can appear multiple times in an app process, pairing logic specifies the first or last sequential instance of the initial and follow-up mapped events across multiple event instances.
-
First-First Pair: Uses the first Initial Event and the first Follow-up Event as a pair.
-
Last-First Pair: Uses the last Initial Event and the first Follow-up Event as a pair.
For example, to set Calculate Conversion Count of successful conversions of First-First pair within 30 seconds and the Initial Event is Login Screen View and the Follow-up Event is Login Success, the criteria is that the two events must occur within 30 seconds to be considered a successful conversion.
-
-
Select an option from the drop-down list to define whether a higher or lower metric value is considered positive. For example, choosing Higher is better indicates that a higher value is desirable, whereas choosing Lower is better indicates that a lower value is desirable.
-
From the Exclusion Event drop-down list, select an event to exclude sessions in which an unwanted event occurs between the starting and ending events.
For example, to measure how often users who provide a valid email successfully complete sign-up without experiencing a Sign-Up Abandoned state, select Sign-Up Abandoned from the list.
-
(Optional) Select one or more dimensions, specify the applicable events, and configure whether the first observed value or last observed value is used as the dimension value.
For example, to analyze a custom metric related to payment based on the first used payment type, select the payment_method dimension recorded on the Network Request event and choose First observed value. After this selection, the payment_method dimension uses the first value observed in the custom metric, enabling dimensional analysis based on this payment type throughout the metric.
For Duration metrics
-
Select events:
-
Initial Event: The first event that triggers a particular process or workflow. It serves as the starting point for measuring and tracking user interactions or system behavior.
-
Complete Event: A complete event that occurs after the Initial Event. It is a continuation or a result of the initial action. The Follow-up Event helps track and measure user engagement or system behavior beyond the initial interaction.
For example, to measure the average duration from login start to successful login, select Login Process Start and Login Success.
-
-
Use the Event Validation Report to confirm whether the configured events have coverage across the required integrated platforms. Deploy any required uncovered events in Semantic Mapper.
For example, if the Validate Report shows that a selected event for Login Success is missing from the Web platform, use Semantic Mapper to map and deploy that event, so the Login Success metric includes the related activities of Web users.
-
Configure metric details:
-
Set pairing logic:
-
Select either of the options:
-
First-First Pair: Uses the first Initial Event and the first Follow-up Event as a pair.
-
Last-First Pair: Uses the last Initial Event and the first Follow-up Event as a pair.
-
-
Choose either first pair or multiple pairs to define count in the same session.
-
first pair: selects only the first pair in a session.
-
multiple pairs: selects all pairs that meet the pairing logic in the same session.
-
Pairing Logic
As the same events can appear multiple times in an app process, pairing logic specifies the first or last sequential instance of the initial and follow-up mapped events across multiple event instances.
For example, suppose there are two mapped events: Login Screen View indicates viewers opening the login page, and Login Success indicates viewers successfully logging into their accounts. In a session, the events are displayed in the following time order: Login Screen View1, Login Screen View2, Login Screen View3, Login Success1, Login Screen View4, Login Success2.
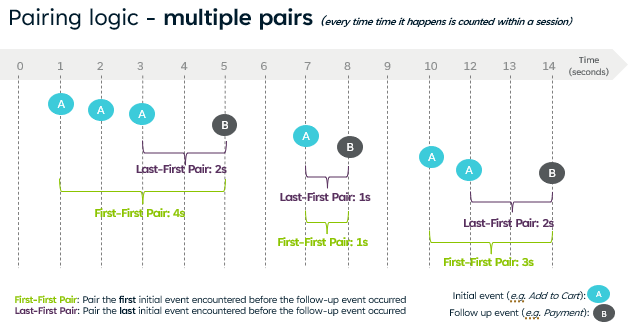
first-first pair last-first pair If selecting first-first pair and first pair If selecting first-first pair and multiple pairs If selecting last-first pair and first pair If selecting last-first pair and multiple pairs Event name Login Screen View1 and Login Success1 Login Screen View3 and Login Success1 Login Screen View1 and Login Success1 Login Screen View1 and Login Success1; Login Screen View4, Login Success2 Login Screen View3 and Login Success1 Login Screen View3 and Login Success1; Login Screen View4, Login Success2 -
-
Set the maximum duration limit.
-
Select an option from the drop-down list to define whether a higher or lower metric value is considered positive. For example, choosing Higher is better indicates that a higher value is desirable, whereas choosing Lower is better indicates that a lower value is desirable.
-
(Optional) To show the distribution of the metric in DPI, select the Distribution check box and fill out the range.
Note: Enabling or disabling the Distribution option for an existing metric does not impact the metric's historical data.
-
(Optional) From the Exclusion Event drop-down list, select an event to exclude sessions in which an unwanted event occurs between the starting and ending events.
For example, to measure how long it takes users who perform a search and receive search results without encountering a Search Error state, select Search Error from the list.
-
(Optional) Select one or more dimensions, specify the applicable events, and configure whether the first observed value or last observed value is used as the dimension value.
For example, to analyze a custom metric related to payment based on the first used payment type, select the payment_method dimension recorded on the Network Request event and choose First observed value. After this selection, the payment_method dimension uses the first value observed in the custom metric, enabling dimensional analysis based on this payment type throughout the metric.
For Event Aggregation metrics
-
Select the source aggregation event. For example, to measure the total number of application errors, select Application Error.
-
Use the Event Validation Report to confirm whether the configured events have coverage across the required integrated platforms. Deploy any required uncovered events in Semantic Mapper.
For example, if the Validate Report shows that a selected event for Login Success is missing from the Web platform, use Semantic Mapper to map and deploy that event, so the Login Success metric includes the related activities of Web users.
-
Configure metric details:
-
Set the value calculation type. When Total values or Average values are selected, a tag key must be selected from the drop-down list
-
Number: Sets the value to the count of the source events.
-
Total Values: Sets the value to the sum of the event attribute values.
-
Average Values: Sets the value to the average or mean of the event attribute values.
-
-
Select an option from the drop-down list to define whether a higher or lower metric value is considered positive. For example, choosing Higher is better indicates that a higher value is desirable, whereas choosing Lower is better indicates that a lower value is desirable.
-
(Optional) Select the Specify the unit of measurement for the collected data check box, and select the required unit.
-
For Ratio metrics
-
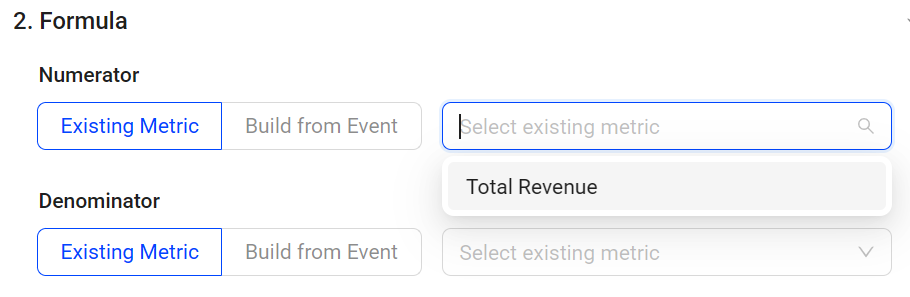
Set numerator values using one of the options:
-
Select existing aggregation metrics from the drop-down list. For example, to track the revenues per paying user, select the Total Revenue metric that is already created.
-
Build the metric from an event:
-
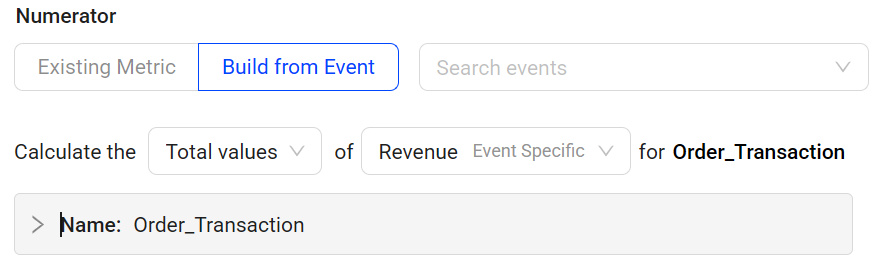
Select a target event to measure. Hover over any mapped event to view its detailed mapping rule and efficiently find the appropriate mapped event. For example, to measure revenue, select the mapped event Order_Transaction.
Note: To map a new event for selection, choose an existing mapped event from the drop-down list, clone it, and update the mapping details to create a new mapped event.
-
Specify the calculation, such as counting event occurrences or calculating the total or average values of tags from the selected event. When Total values or Average values are selected, a tag key must be selected from the drop-down list. For example, to measure revenue, select Total values as the calculation method and Revenue as the event tag.
-
Count: Sets the value to the count of source events.
-
Total Values: Sets the value to the sum of event attribute values.
-
Average Values: Sets the value to the average or mean of the event attribute values.
-
-
(Optional) Click Edit to update the event name or event rules.
-
Use the Event Validation Report to confirm whether the configured events have coverage across the required integrated platforms. Deploy any required uncovered events in Semantic Mapper.
For example, if the Validate Report shows that a selected event for Login Success is missing from the Web platform, use Semantic Mapper to map and deploy that event, so the Login Success metric includes the related activities of Web users.
-
-
-
Set denominator values using one of the options:
-
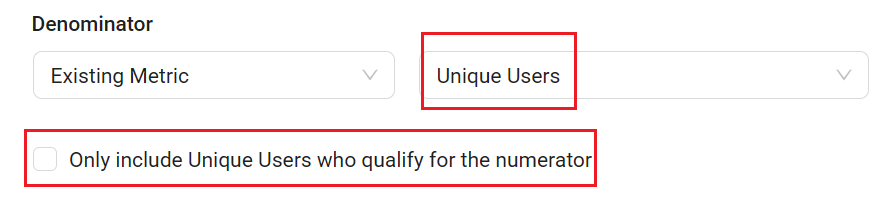
Select existing aggregation metrics from the drop-down list. For example, to track the revenues per paying user, select the Unique Users as the denominator.
When selecting one of these metrics as the Denominator including User Sessions, Unique Users, and Unique Devices, select or clear the check box to control how the denominator is measured based on the analysis objective.
For example, to analyze revenue per paying user, select the check box Only include Unique Users who qualify for the numerator to ensure that only users who actually made a purchase are counted. To analyze revenue per user, clear the check box to include all users in the calculation.
-
Build the metric from an event:
-
Select a source aggregation event. Hover over any mapped event to view its detailed mapping rule and efficiently find the appropriate mapped event.
Note: To map a new event for selection, choose an existing mapped event from the drop-down list, clone it, and update the mapping details to create a new mapped event.
-
Specify the calculation, such as counting event occurrences or calculating the total or average values of tags from the selected event. When Total values or Average values are selected, a tag key must be selected from the drop-down list.
-
Count: Sets the value to the count of source events.
-
Total Values: Sets the value to the sum of event attribute values.
-
Average Values: Sets the value to the average or mean of the event attribute values.
-
-
(Optional) Click Edit to update the event name or event rules.
-
Use the Event Validation Report to confirm whether the configured events have coverage across the required integrated platforms. Deploy any required uncovered events in Semantic Mapper.
For example, if the Validate Report shows that a selected event for Login Success is missing from the Web platform, use Semantic Mapper to map and deploy that event, so the Login Success metric includes the related activities of Web users.
-
-
Use a fixed number as a denominator:
Select Fixed Number from the drop-down list and enter the desired value in the field. For example, when analyzing revenue in euros based on U.S. dollar data, apply the current USD-to-EUR exchange rate as the fixed denominator to calculate the Ratio metric for a common currency analysis.
-
-
Configure metric details:
-
(Optional) Select the required unit from the drop-down list.
-
Select an option from the drop-down list to define whether a higher or lower metric value is considered positive. Choosing Higher is better indicates that a higher value is desirable, whereas choosing Lower is better indicates that a lower value is desirable. For example, to track the revenues per paying user, select Higher is better.
-
-
-
Click Save and Deploy to complete the deployment.
Note: When updating custom metrics, use the Keep historical data checkbox to control whether existing data is retained. Select the checkbox to keep the data, or clear it to remove it. The checkbox is selected by default.
The deployment takes several minutes to take effect.
DPI Custom Metrics DPI Custom Metrics metric builder metric builder flow flow flow metrics flow metrics