The Resiliency Tracking dashboard provides an summary of the Impact Avoidance Events that are triggered by Precision due to deviation in CDN performance.
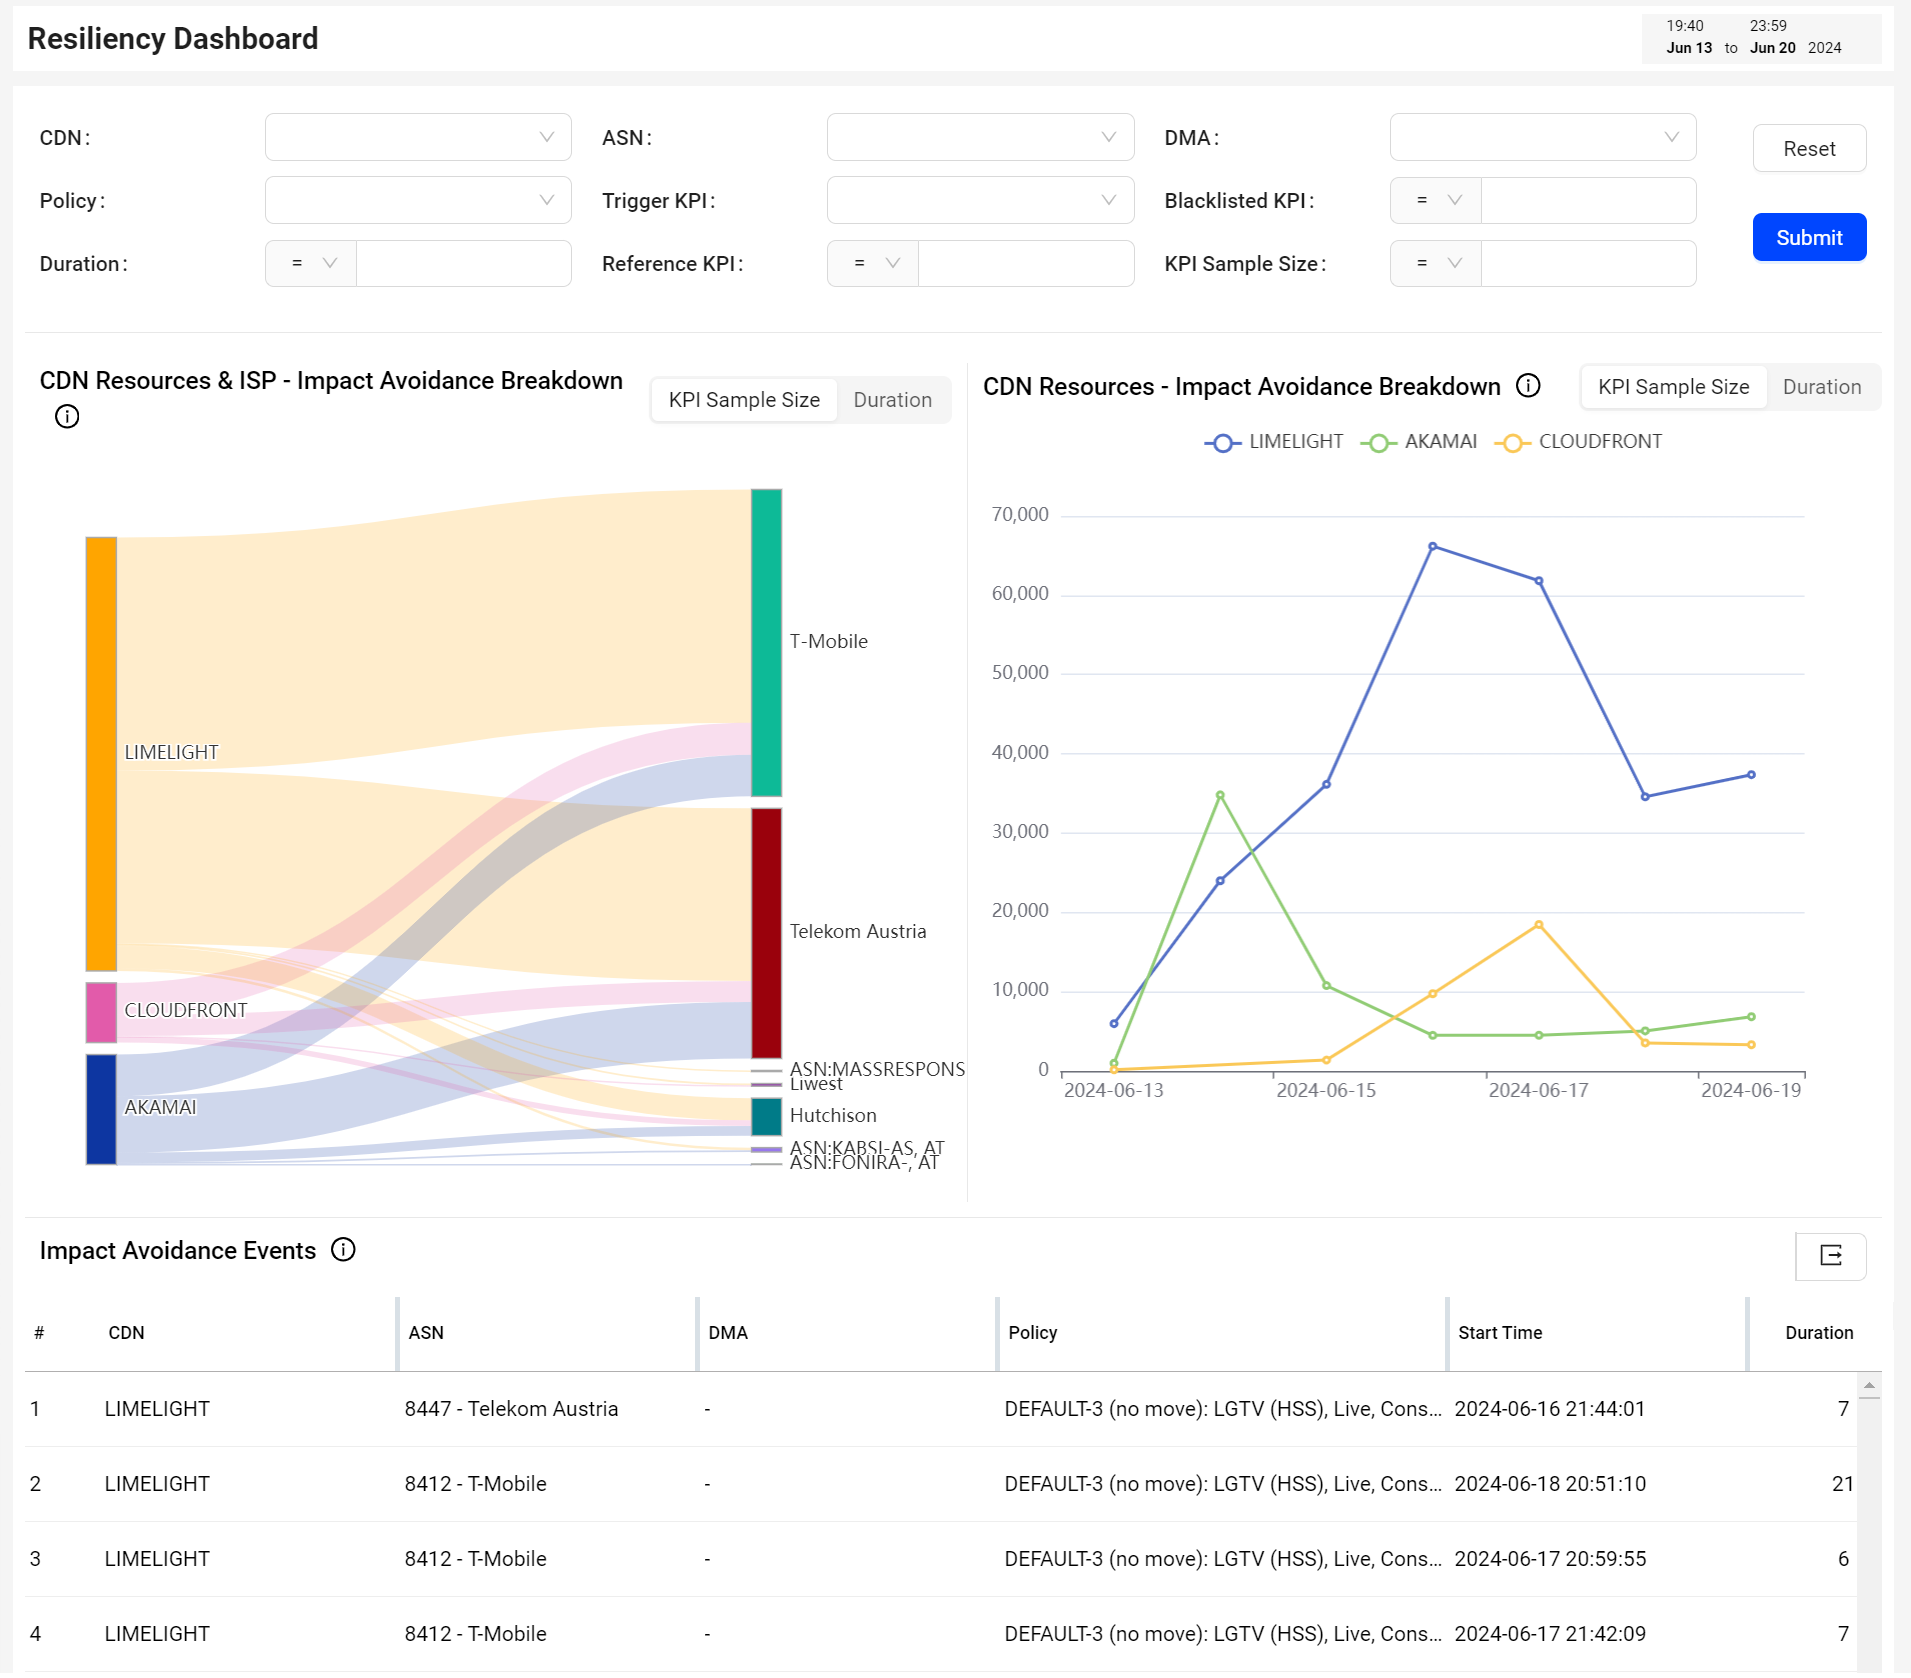
Filters
Use the filters to focus your overview on specific CDN resources. You can also apply filters based on Autonomous System Number (ASN), Designated Market Area (DMA), Precision Policy, Duration, Trigger KPI, KPI Sample Size, Blacklisted KPI, and Reference KPI.
Click the drop-down and select the values to create complex filters based on logic OR filter rules.
Click Submit to display the results based on your filter values.
Resiliency Tracking Widgets
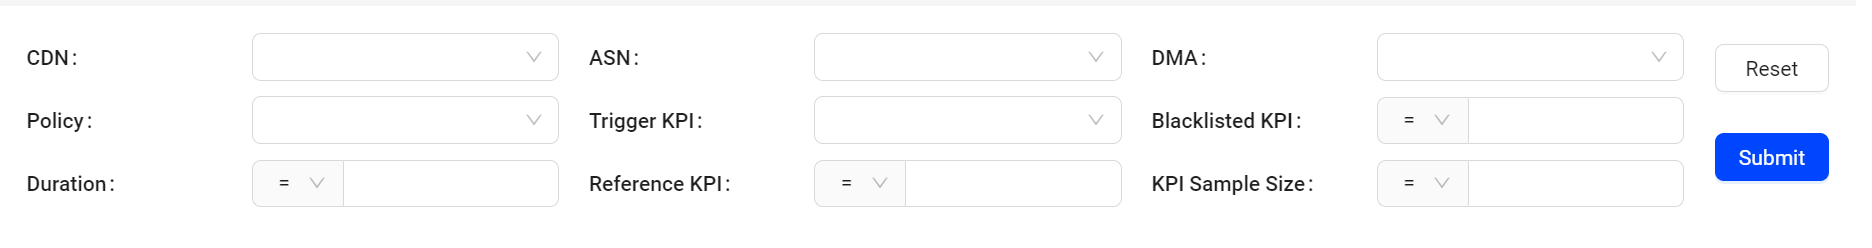
The Resiliency Tracking widgets display the avoided impact and time, daily impact saved by each CDN resource, top CDN ISPs based on avoided impact and time, and a summary of avoided events.
CDN Resource and ISP -- Impact Avoidance Breakdown by KPI Sample Size
The Top CDN ISP by Impact Avoided widget displays a visual representation of the top ISPs for every avoided CDN resource based on the KPI sample size.

CDN Resource and ISP -- Impact Avoidance Breakdown by Duration
The Top CDN ISP by Time Avoided widget displays a visual representation of the top ISPs for every avoided CDN resource based on the duration.
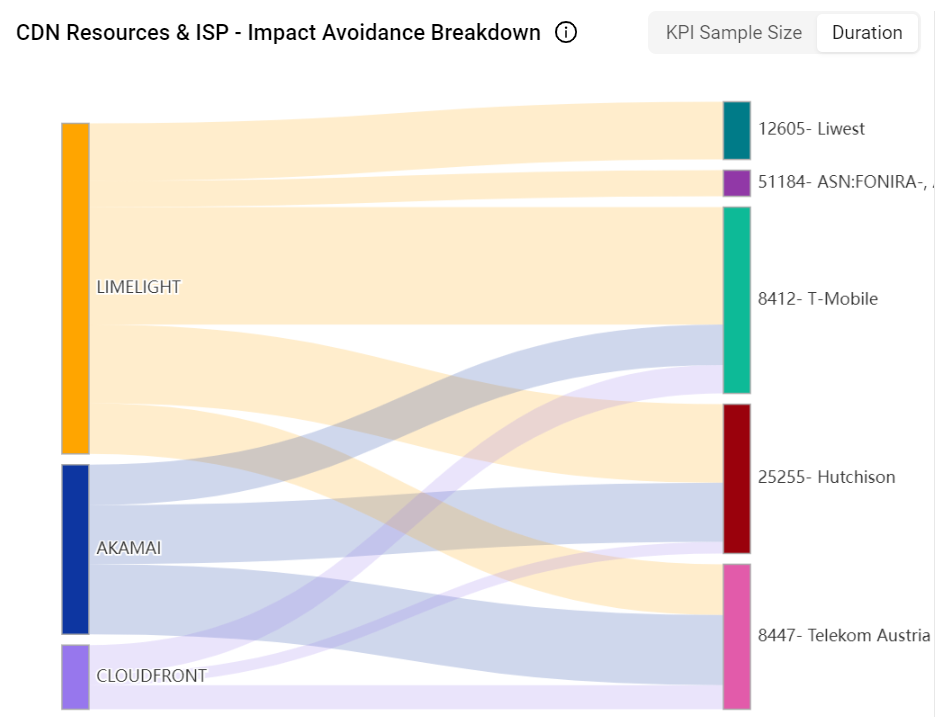
Daily Impact Saved by Resource
The Daily Impact Saved by Resource widget displays the level of impact avoided each day by a CDN resource.

Click on an intersection point of Level of Impact Avoided and Day. A pop up box appears.
![]()
Note: The level of impact for the current day is low because the data collection is in-progress.
Explore
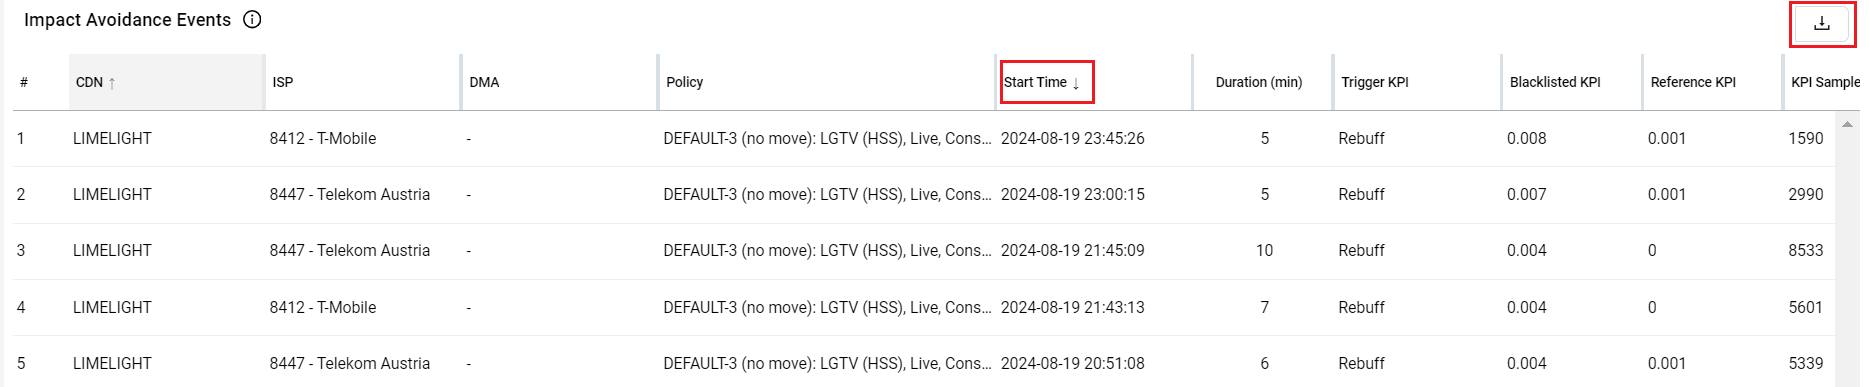
Provide the Kpi_sample_size details and select the condition as required to view the details of ISPs that avoided impact in that CDN resource. Each row contains the ISP, Precision policy, Start Time, Trigger KPI, Duration, Blacklisted KPI, Reference KPI, and KPI Sample Size.

Click Export to download the data in .csv format.
Drill into <day>
Click Start Time to view all KPI sample sizes for each CDN resource per day sorted using the starting time of the impact. Click Export to download the data in .csv format.
Click KPI sample size to view the details of ISP that avoided impact in that CDN resource. Click Export to download the data in your preferred file format.

Blacklisting KPIs
Provide the Blacklisting KPIs details in the filter. The widget displays the details of all ISPs for every avoided CDN resource. Each row contains the avoided CDN resource, ISP, DMA, Precision policy, , Start time, Duration, Blacklisted KPI, Reference KPI, and KPI Sample Size.

| Metric | Definition |
|---|---|
| Duration (min) | The duration in minutes of the avoided CDN (Blacklisting) event during which the traffic from the blacklisted resource is diverted to other resources. |
| Blacklisted KPI | The Trigger KPI (CIRR, VSF, etc.) value of the blacklisted resource at which the avoided CDN (blacklist event) is triggered. |
| Reference KPI | The Trigger KPI value of the best resource which is used as a reference to calculate the deviation of the blacklisted resource. If the deviation specified in Precision rules is breached, then the blacklist event is triggered. |
| KPI Sample Size | The number of total attempts of blacklisted resource which were considered to calculate the deviation of KPI. |
Click Export to download the data in .csv format.
Resiliency Tracking Resiliency Tracking Resiliency Tracking