Conviva's Real-Time dashboard visually presents QoE metrics for actionable streaming intelligence in real-time. Enhanced by selected filters and dimensions, you can monitor the performance of your most critical streaming KPIs with visual threshold crossing indicators to quickly identify and correlate changes in QoE metrics.
With up to 20 filters and 200 monitored dimension values per Real-Time dashboard, you can customize the dashboard settings to focus on the most critical performance, such as Live traffic across channels for tent pole events or All Traffic across assets for ongoing operations.
Note: Real-Time data is also available in Trends dashboard selecting Live mode in date picker.
Conviva enhances real-time data analysis for improved actionability and reduced latency to optimize live streaming performance through its Trends functionality.
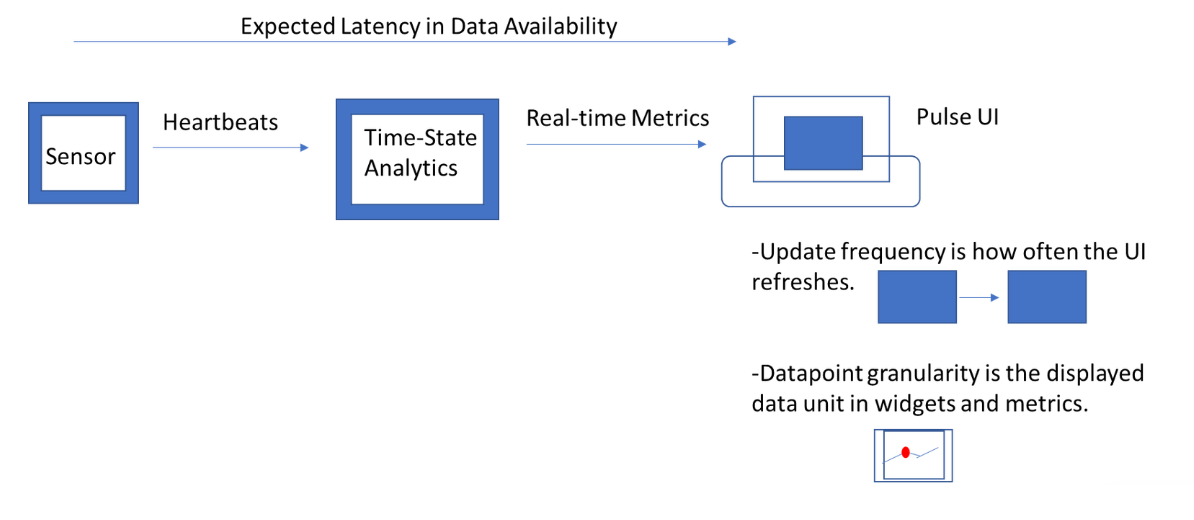
Conviva continuously calculates real-time data based on a continuous stream of heartbeats from devices used by active viewers.
In most cases,
-
Data refresh every 20 seconds.
-
Expected data latency of less than 30 seconds
This ensures that users receive real-time and highly accurate insights, enhancing their ability to make informed decisions promptly.
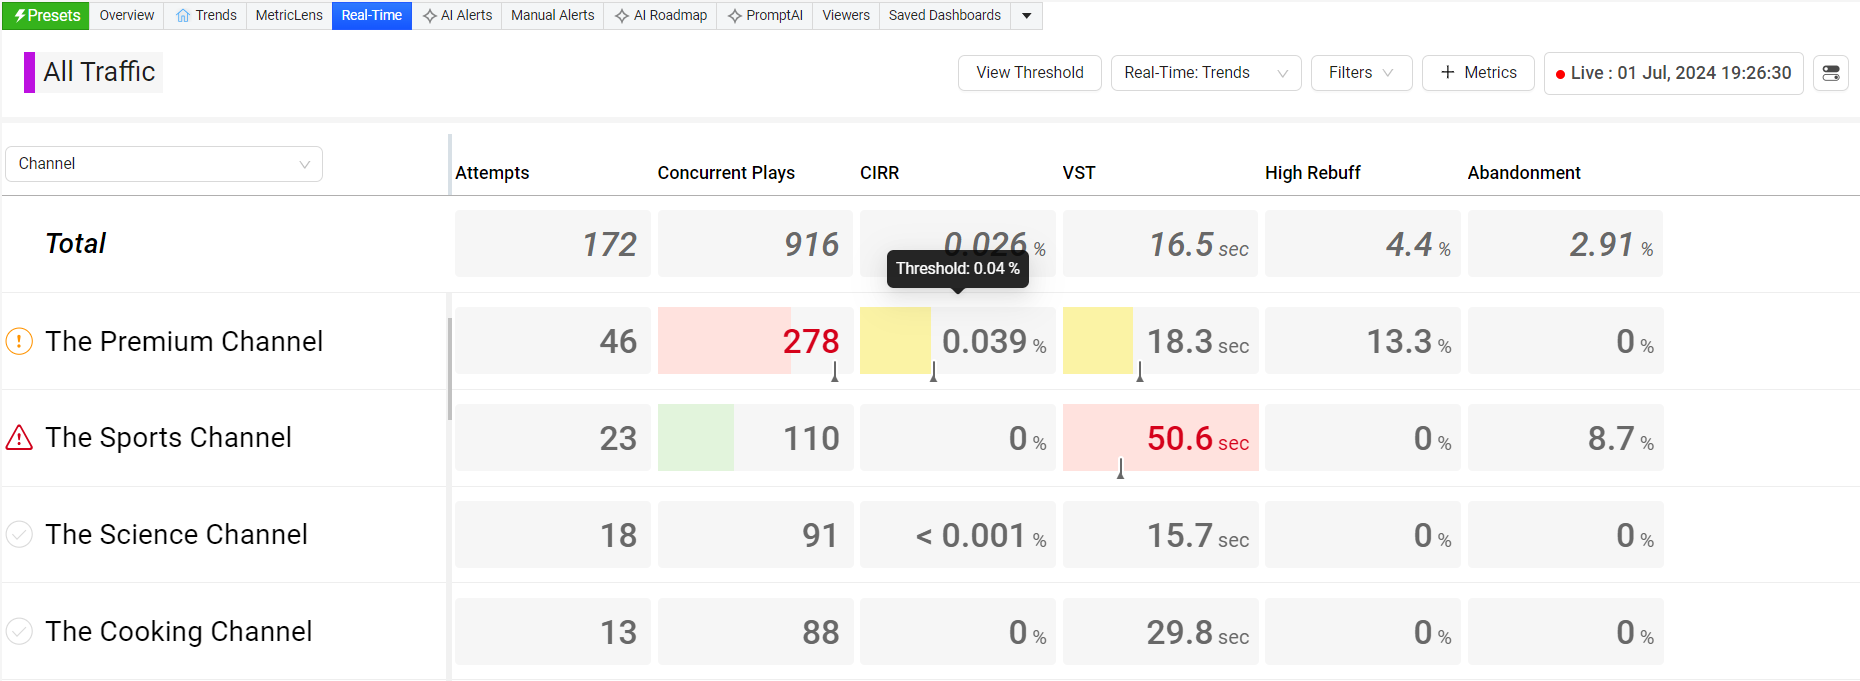
The metric along with the value displays the threshold value, when you mouse hover on the metric display.
When a threshold is crossed, the impacted metric turns red. Click the metric value to open the Diagnostics page with data for the impacted dimension and filter settings.
Real-Time Dashboard for Video
Video Real-Time dashboard shows the video metrics with color-coded threshold monitoring.
For more details about real-time monitoring, see Real-Time Dashboard.
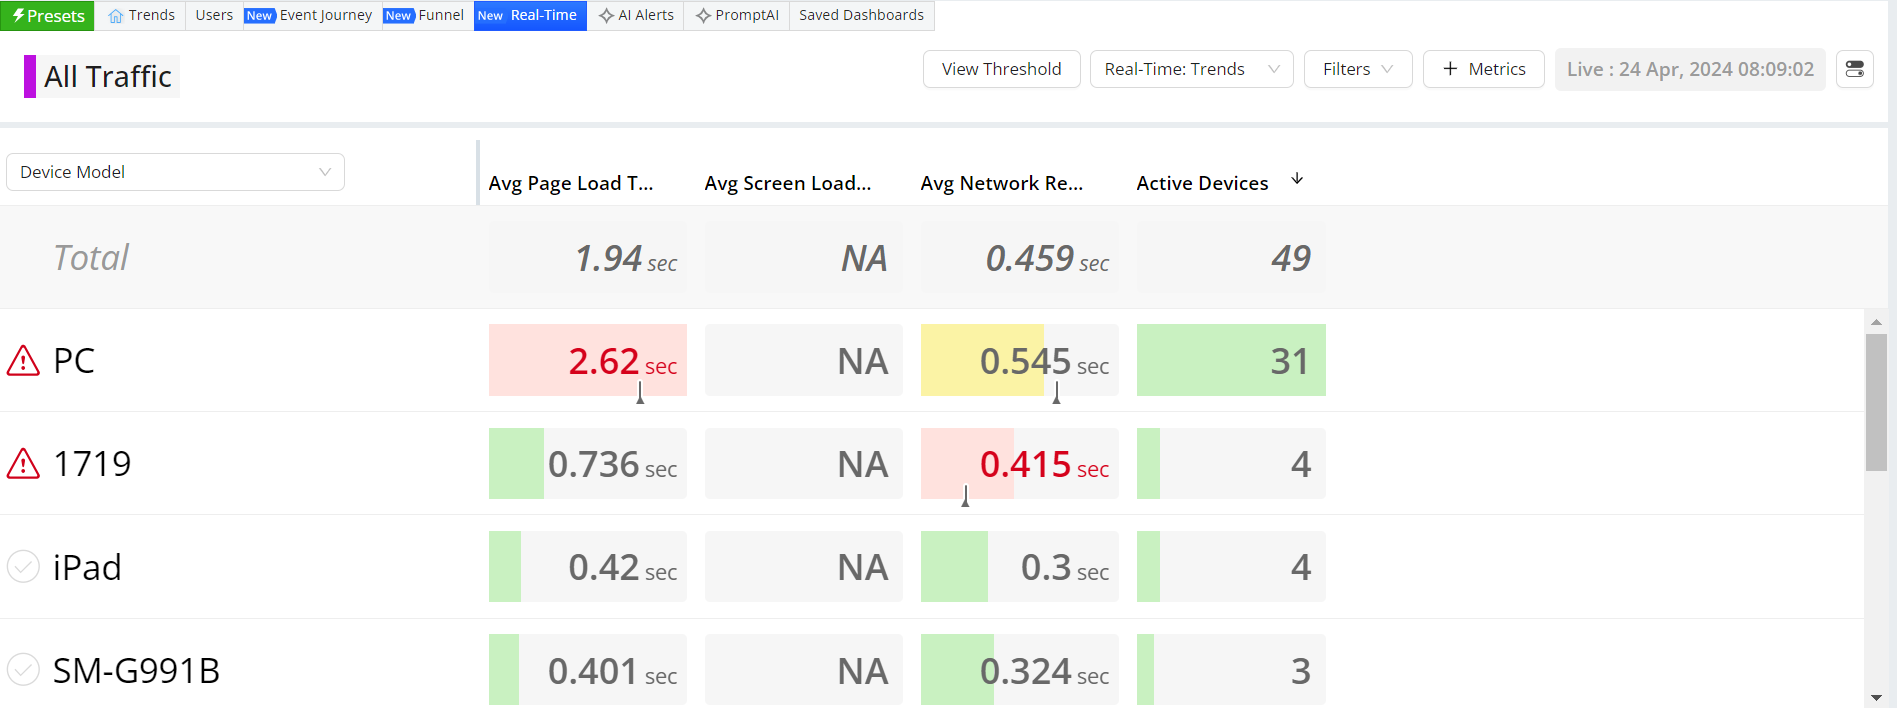
Real-Time Dashboard for ECO
ECO Real-Time dashboard shows the ECO metrics with color-coded threshold monitoring.
For more details about real-time monitoring, see Real-Time Dashboard.
Real Time Dashboard Real Time Dashboard Real Time Dashboard Thresholds Threshold crossing alerts Enable Auto Sort