The Pattern Analytics tab shows the event sequences from the starting event to the milestone with progress and conversion data.
Paths provide the visual breakout of the various event sequences users followed to reach the milestone. The screen shows the event path users took to complete a purchase and reach the Receipt View milestone.
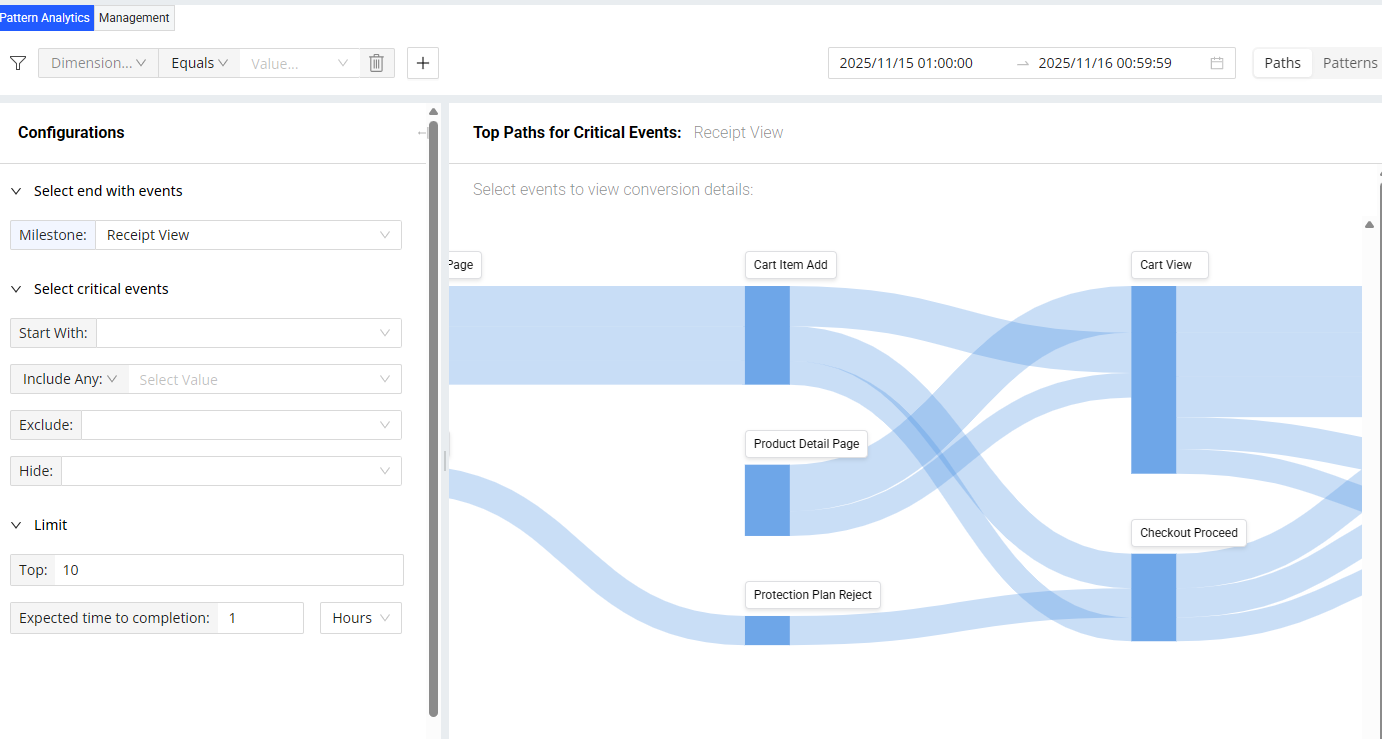
The Paths view also enables the display of conversion funnels to visualize drop-offs between each step in the sequence and explore opportunities for step conversion improvements.

Paths
Paths provide a visual breakdown of the event sequences that lead to a selected milestone event.
Paths are based on a selected milestone event, such as a checkout completion, a payment failure, or any other defined experience milestone, and map the various event routes users followed to reach that outcome. Select Start With and End With (milestone) to see the top paths taken, or choose End With (milestone) alone or End With together with Start With to view all paths leading to the milestone.
Paths help identify dominant behavior patterns, unexpected navigation routes, and potential issues occurring earlier in the journey. These insights support validation of designed patterns, reveal entry-point variations, and highlight opportunities for experience optimization.
Note: To generate a shareable link for easy collaboration, click the Share button in Path View.
Configuring Paths
After configuring Paths, select critical events in the Paths to drill down for deeper analysis.
-
Select the milestone event.
For example, to analyze Paths that lead up to successful payments, select Successful Payment event.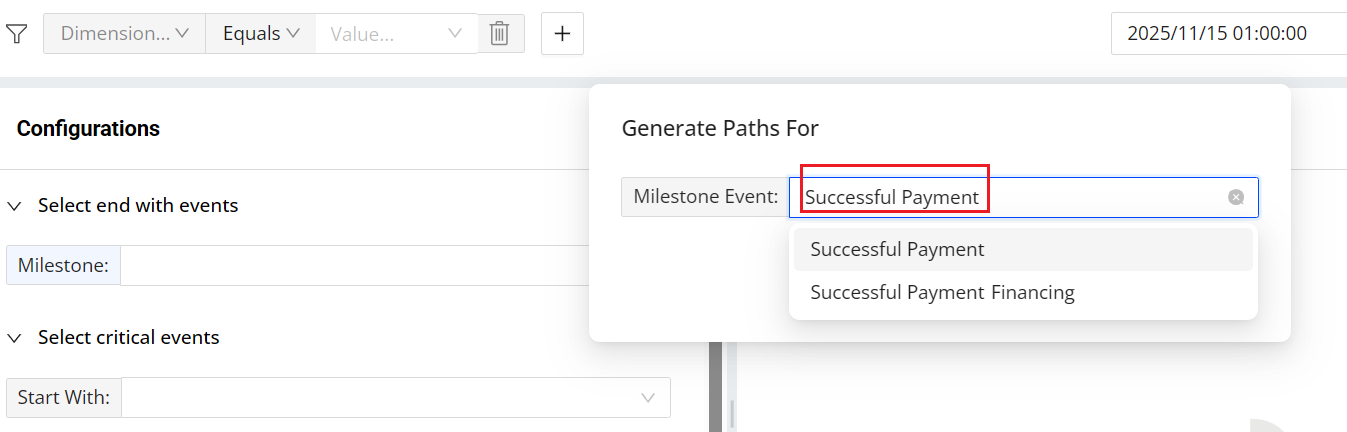
-
Check the displayed paths from the right panel and set the critical events per requirement:

-
Start With: Define the required starting event.
For example, to analyze payment performance, set Cart View as the Start With event so the Path must begin at the actual start of a payment attempt. -
Include Any: Ensure that at least one of the specified events is included.
For example, add Checkout Page View to Include Any to confirm that the user viewed the checkout page at least once during the journey. -
Include Every: Require that all selected events appear in the Path.
For example, if payment process requires users to pass both Shipping Address Submitted and Payment Method Selected, add both as Include Every. -
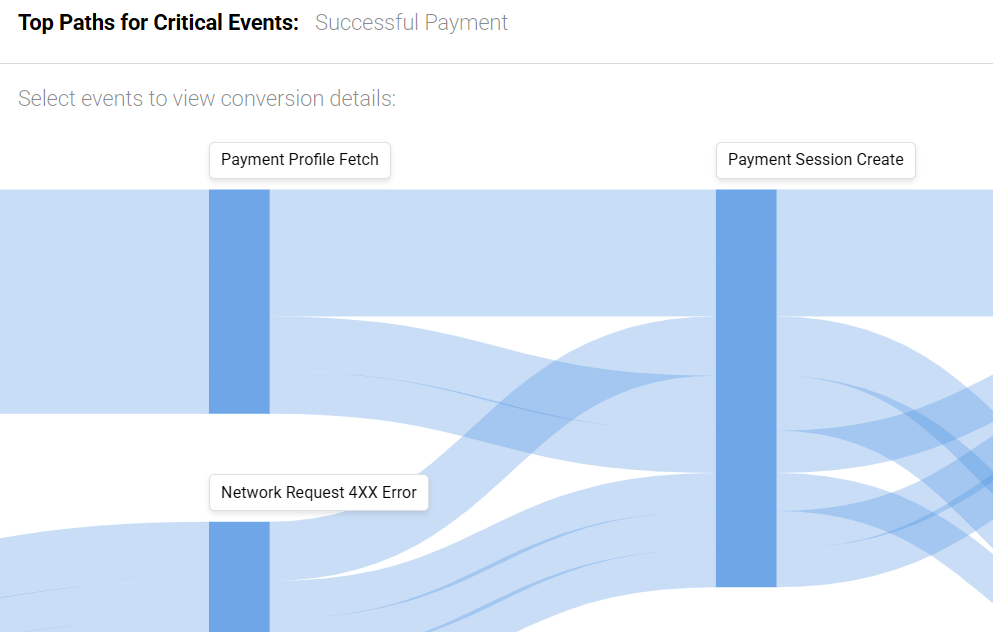
Exclude: Filter out all paths that contain any of the selected events.
For example, exclude Network Request 4XX Error to prevent patterns that include failed or interrupted sessions. -
Hide: Remove selected events from the visualization to keep the Paths view clear and focused.
-
-
Specify the number of top Paths that meet configurations.
For example, set the limit to 8: Only the eight most frequent matching paths will be displayed. By default, the top 10 paths are shown, ordered by traffic volume (devices). -
Set the expected time to completion.
For example, set 30 minutes. Only the Paths that complete the path from start to milestone within 30 minutes are displayed in the right panel. -
Set the time range. The time range must be within the last 30 days and no longer than 7 days.
-
(Optional) Set filters to focus on specific traffic or user groups.
For example, to analyze only desktop traffic, set Platform as the dimension and web as the value.
Checking Paths and Viewing Detailed Analysis
After applying the configurations, the right-side slide-out panel displays the top Paths configured with that milestone event.
-
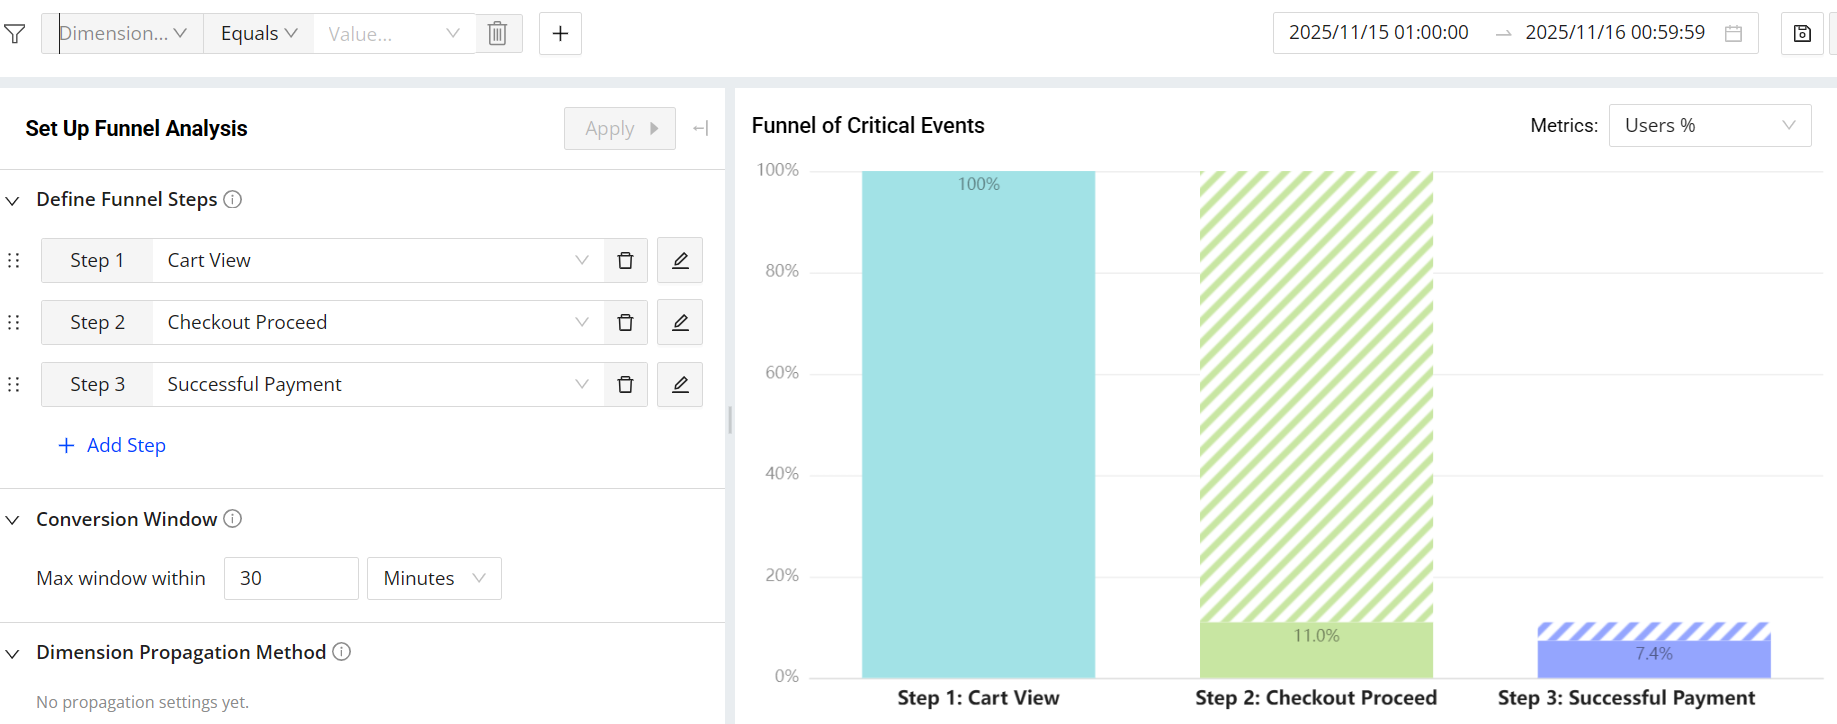
Click critical events to get a Funnel for drilling down to detail funnel analysis. For example, click Cart View, Checkout Proceed, and Successful Payment to analyze the specific journey.
Note: To create a new funnel analysis, click the + button in the tab area of Pattern Analytics or click the + Funnel Analysis button.

-
Click View Detailed Analysis to open the Funnel view page.
-
Modify the Funnel as needed, such as removing or adding steps, and updating steps.
-
To analyze performance specific to a channel, apply filters such as: Platform = Web.
-
Set the conversion window. For example, set 30 minutes to count only those conversions complete within this timeframe in the Funnel.
-
After setting the dimensions, choose a propagation method to control how dimension values are applied across a user journey. For example, preserve attribution metadata captured early in the funnel.
-
First: Pick up the first value seen on this device in the queried time range and apply it to all steps of the funnel.
For example, select this option when metadata appears only at the beginning of the journey, such as UTM parameters captured at landing. -
Last: Pick up the most recent value observed within the funnel and apply it to all steps of the funnel. If a user initiates the pattern multiple times, each instance applies the latest value available within its own sequence of steps.
For example, select this option when metadata appears in downstream steps but does not exist in later events, such as payment method captured only at the Payment step. -
Step-Specific: Extract the dimension value from a particular step.
For example, select this option when the value differs across steps and the step-specific value is the one that matters most, such as app name varying by step due to legacy vs. new stack migration.
-
-
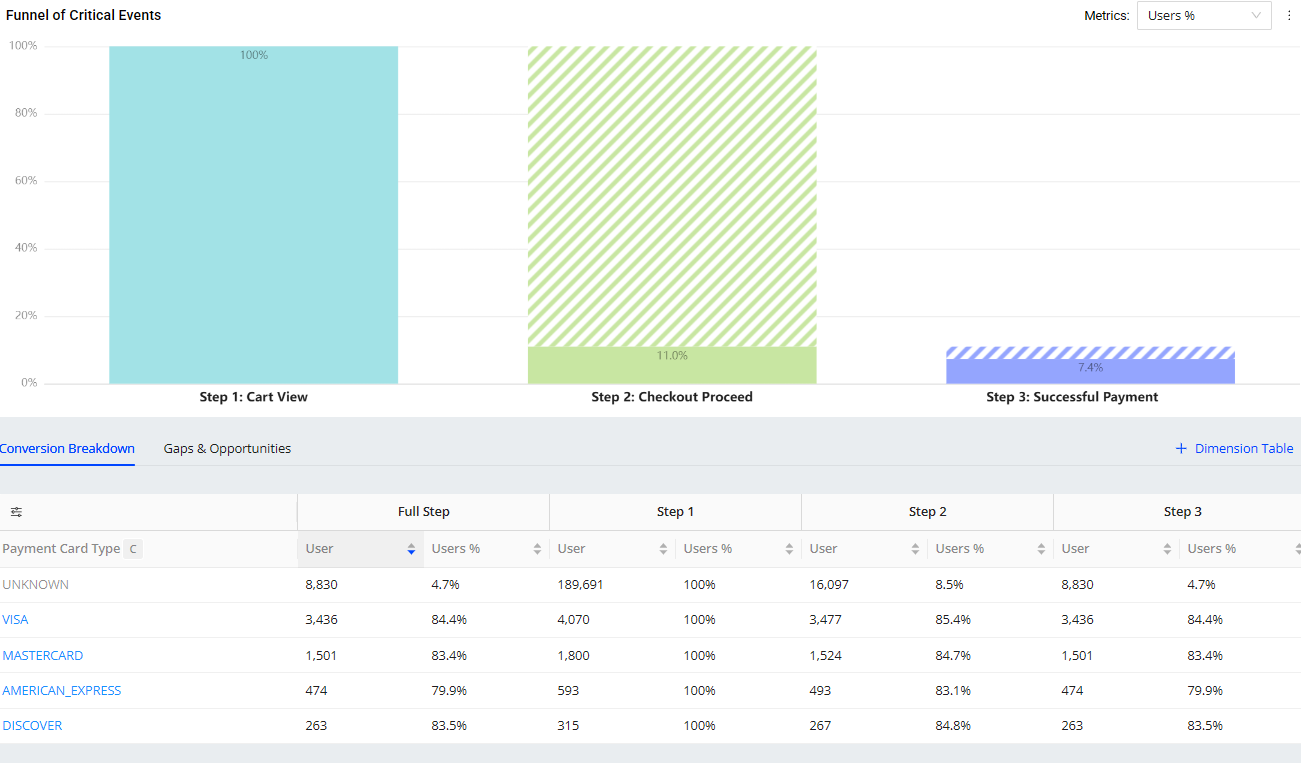
Add dimension tables to understand conversion breakdown.
For example, using Payment Card Type as the dimension shows which card types users prefer or whether a particular card type has lower success rates.
-
Click the shaded area in the funnel chart to view drop-offs from the previous step. This function provides actionable insights into where users are leaving the journey, highlighting opportunities to improve performance.
