Conviva's Real-Time dashboard provides a visual presentation of ad metrics for actionable streaming intelligence in real time. Enhanced by selected filters and dimensions, you can monitor the performance of your most critical streaming KPIs with visual threshold crossing indicators to quickly identify and correlate changes in ad metrics. With up to 20 filters and 200 monitored dimension values per Real-Time dashboard, you can customize the dashboard settings to focus on the most critical performance, such as Live traffic across channels for tent pole events or All Traffic across assets for on-going operations.
The Real-Time has two modes—Trends mode supports monitoring video streaming performance based on selected filters across dimensions, while the Real-Time Filters mode supports monitoring video streams based on selected filters. Save and Share dashboards for quick access to recurring diagnostics and monitoring.
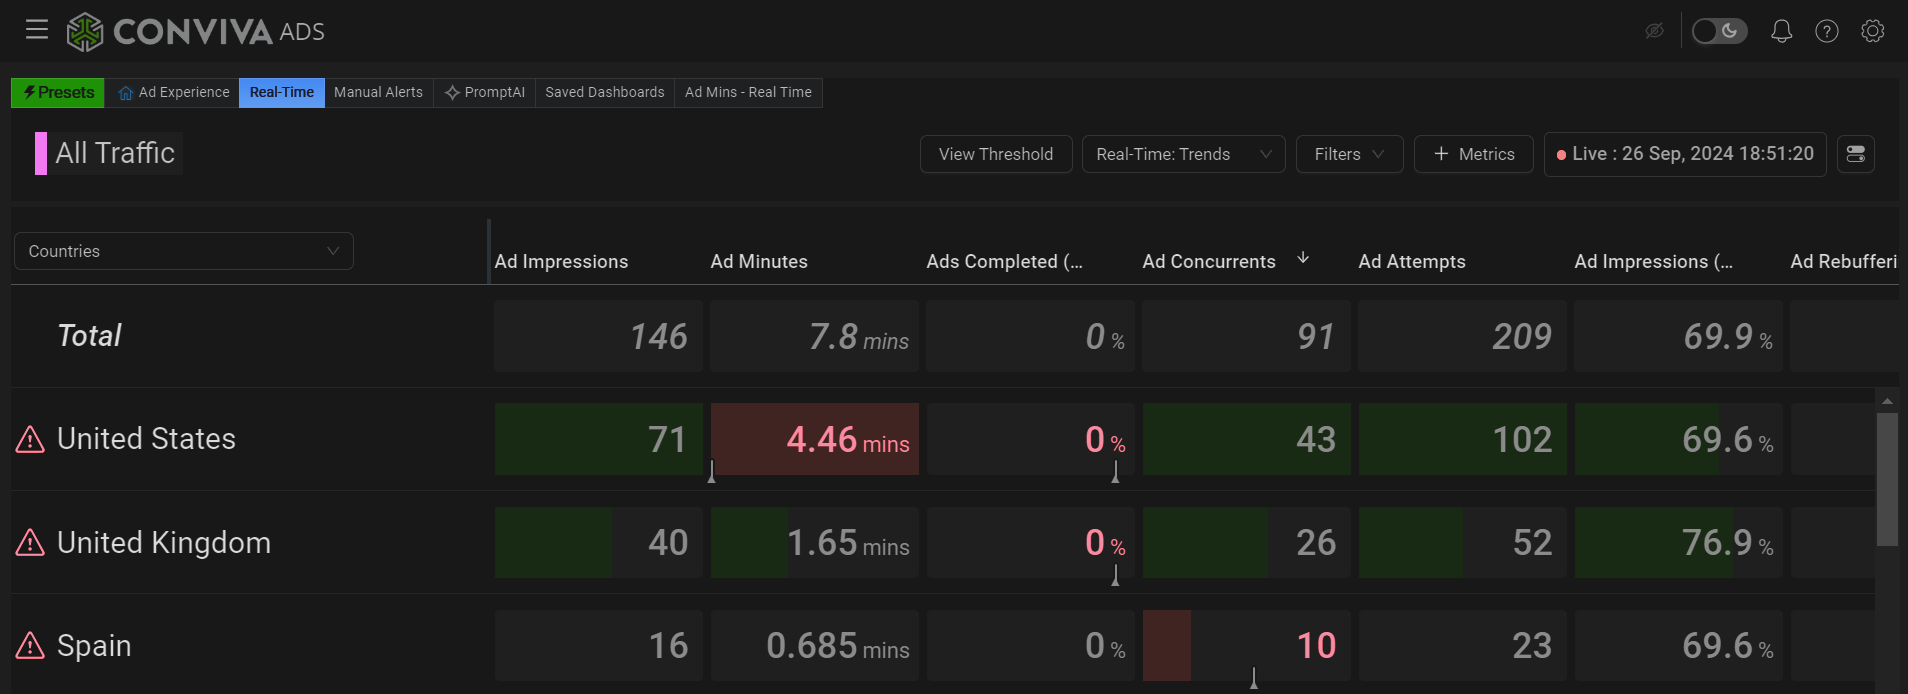
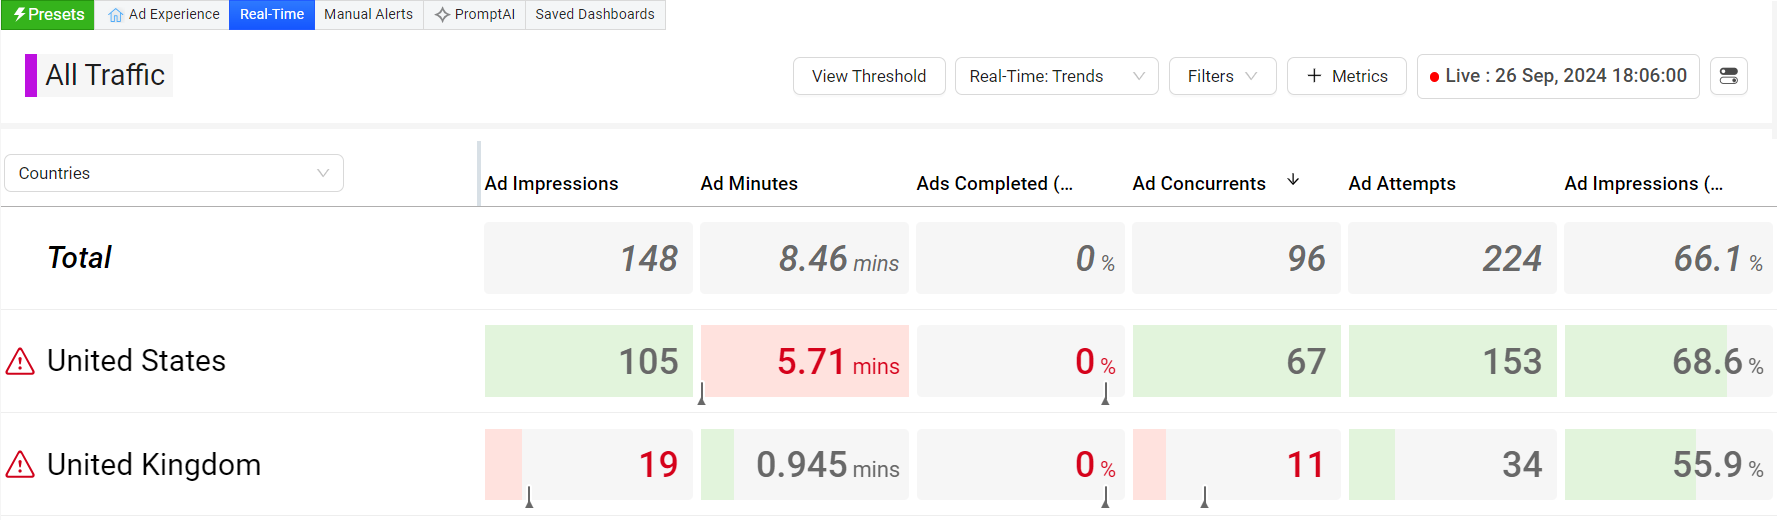
When a threshold is crossed the impacted metric turns red to indicate the threshold was reached. You can then click the metric value to open the Diagnostics page with data for the impacted dimension and filter settings.
The Real-Time dashboard displays in light and dark modes for enhanced visual monitoring on desktops, tech ops centers and NOCs. By default, data is sorting by Ad Concurrents.
Dark Mode:
Setting Up Real-Time Monitoring
To access the Real-Time dashboard:
Click the Real-Time tab next to the Ads view.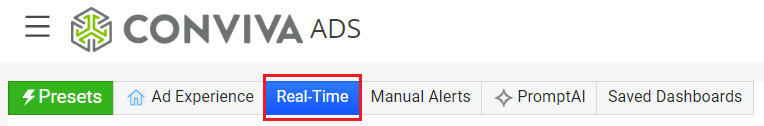
This opens the Real-Time dashboard with the default or your previous settings.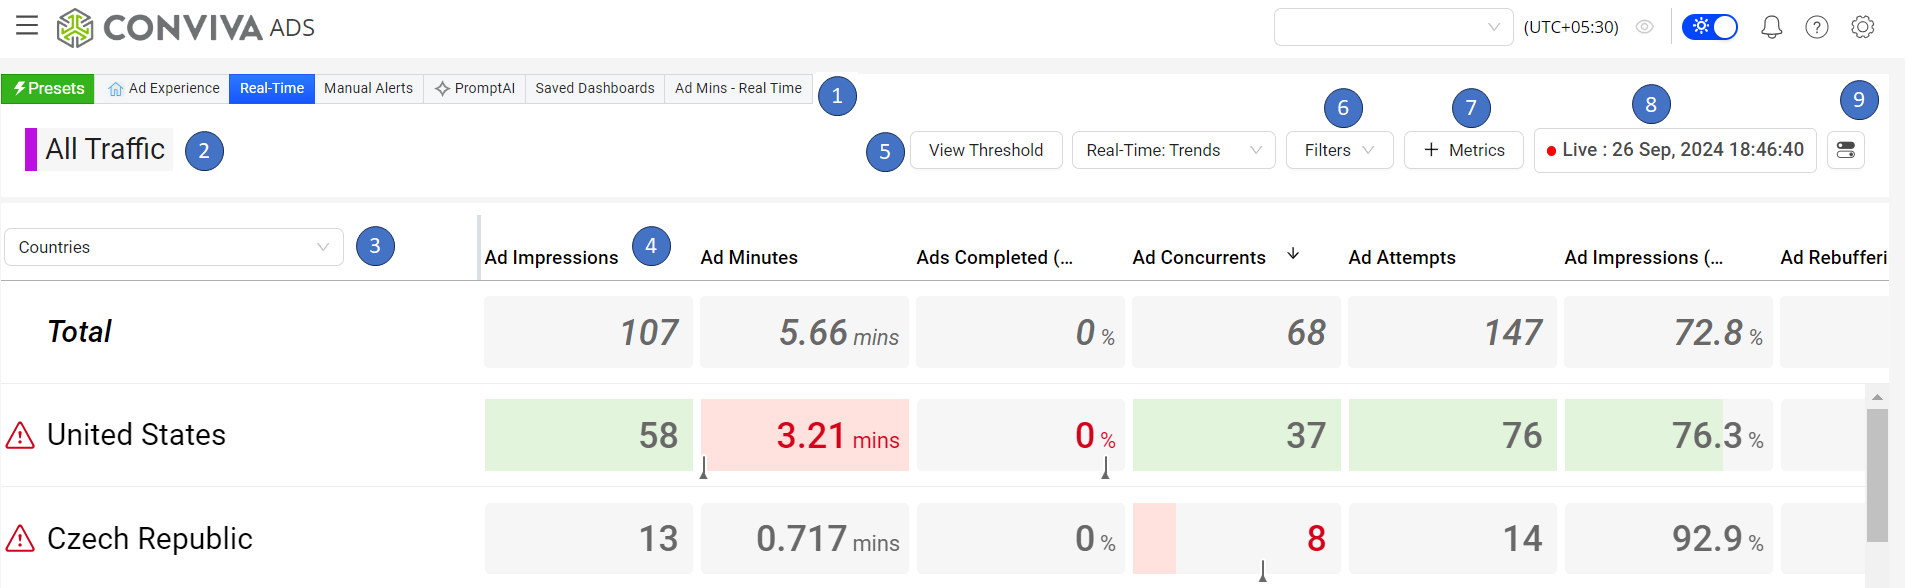
Switch between Ads, Real-Time, and other tabs. Also, displays tabs for any new and saved dashboards.
Filter bar to display current filter settings (All Traffic by default).
Selector for dimensions applied to the current filters.
Metric Values with threshold crossing visual indicators.
Selector for Top Trends and Filter views. Top Trends displays the selected metrics by filer and dimension values; Filters displays the selected metrics for each of the applied filters.
Filter button with quick access to add and modify filters, either from saved filters, or create new filters on the Trends page to use in real-time monitoring.
This opens the Real-Time dashboard with the default or your previous settings.
Date/Time for the current data. The data is aggregated over a 60-second sliding window and refreshes every 20 seconds.
Hamberger icon for Share, Export, Save, Threshold settings, Make Default, Dark/Light modes, Enable Autosort, and Make Default.
Real-Time Thresholds
To configure threshold settings,
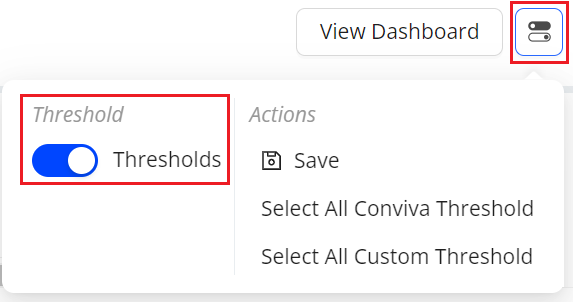
Click the hamberger icon and select Thresholds.

The Manage Threshold page appears with the Conviva and Custom thresholds.
The page allows setting and saving custom thresholds for an entire column, aligning metrics with the main dashboard to improve monitoring efficiency.
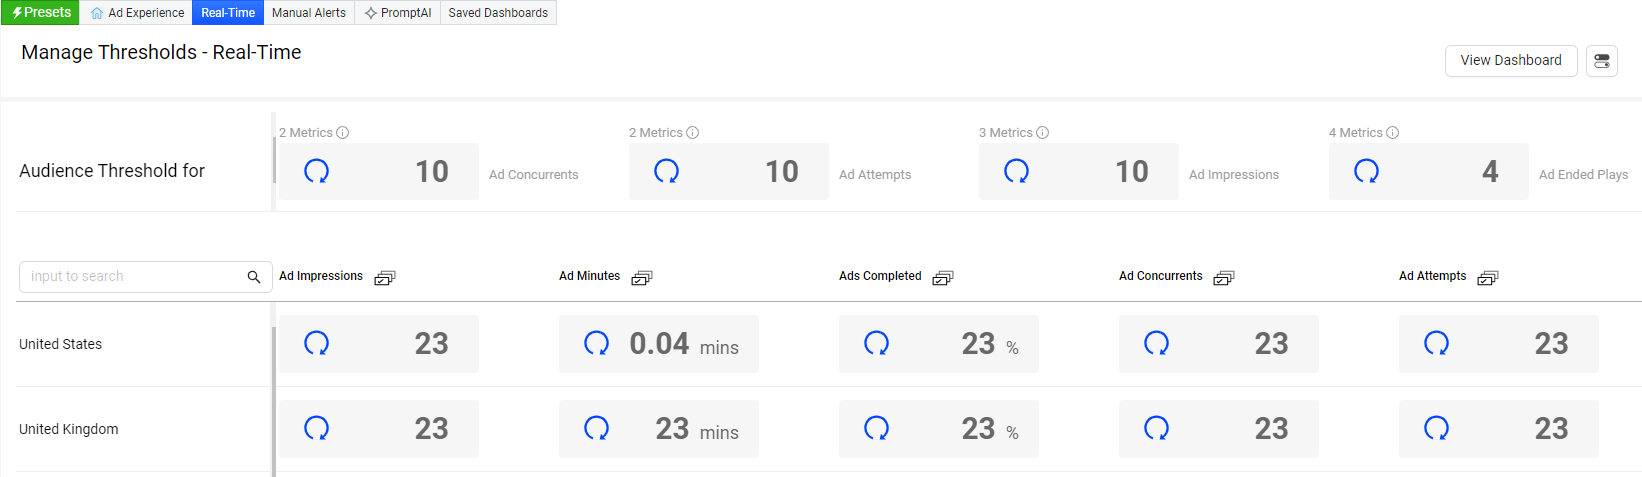
Conviva leverages machine learning to determine the Conviva threshold settings for each metric in each audience segment. You can use these settings or override them with custom thresholds.
You can use these settings or override them with custom thresholds.
Click the Hamberger icon and click Thresholds toggle button
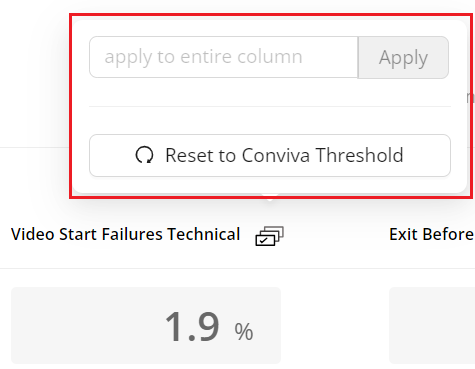
Click the text box to enter a new value
Click the Hamberger icon and select Save
Click the reset icon to set the value to Conviva threshold

You can apply and reset threshold for the entire metric column, by clicking the Hamberger icon and using the option to apply threshold for that metric.
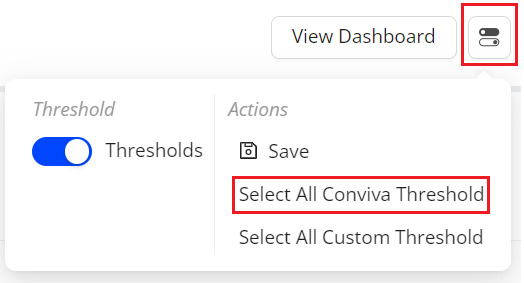
Also, Real-Time dashboard provides an option to select the set Conviva threshold values or Custom threshold values for all the displayed assets.
Click Hamberger icon and select Select All Conviva Threshold, to see the set Conviva values across dimensions.
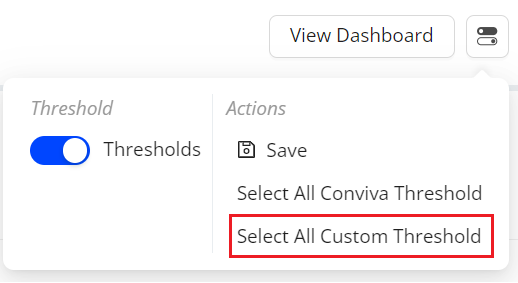
Click Hamberger icon and select Select All Custom Threshold, to see the Custom values across dimensions.
Conviva thresholds are available for customers with the Advanced AI Alerts package. The filter/dimension combinations where Conviva AI thresholds are available include combinations of All Traffic, Live, VOD, Channels, Protocol, CDN, ISP (same as the AI Alert impacted groups).
By default, real-time data is auto-sorted by Concurrent Plays and any data with a metric (CIRR) that exceeds a threshold (red highlight) is moved to the top of the data display.
The Real-Time Dashboard displays metric highlight bars as Grey / Green / Yellow / Red based threshold status.
Grey when the metric threshold is not configured or the Audience impact thresholds are less than the configured values (no audience impact).
Green when the Audience impact threshold (for example Attempts ) is met, and the metric threshold (Conviva or custom) is available.
Yellow if the value is between 90% and 100% of the threshold, indicating it is approaching the threshold.
Red once the value crosses the threshold.
A small threshold crossing indicator indicates the threshold value relative to the metric value for the YELLOW and RED boxes.
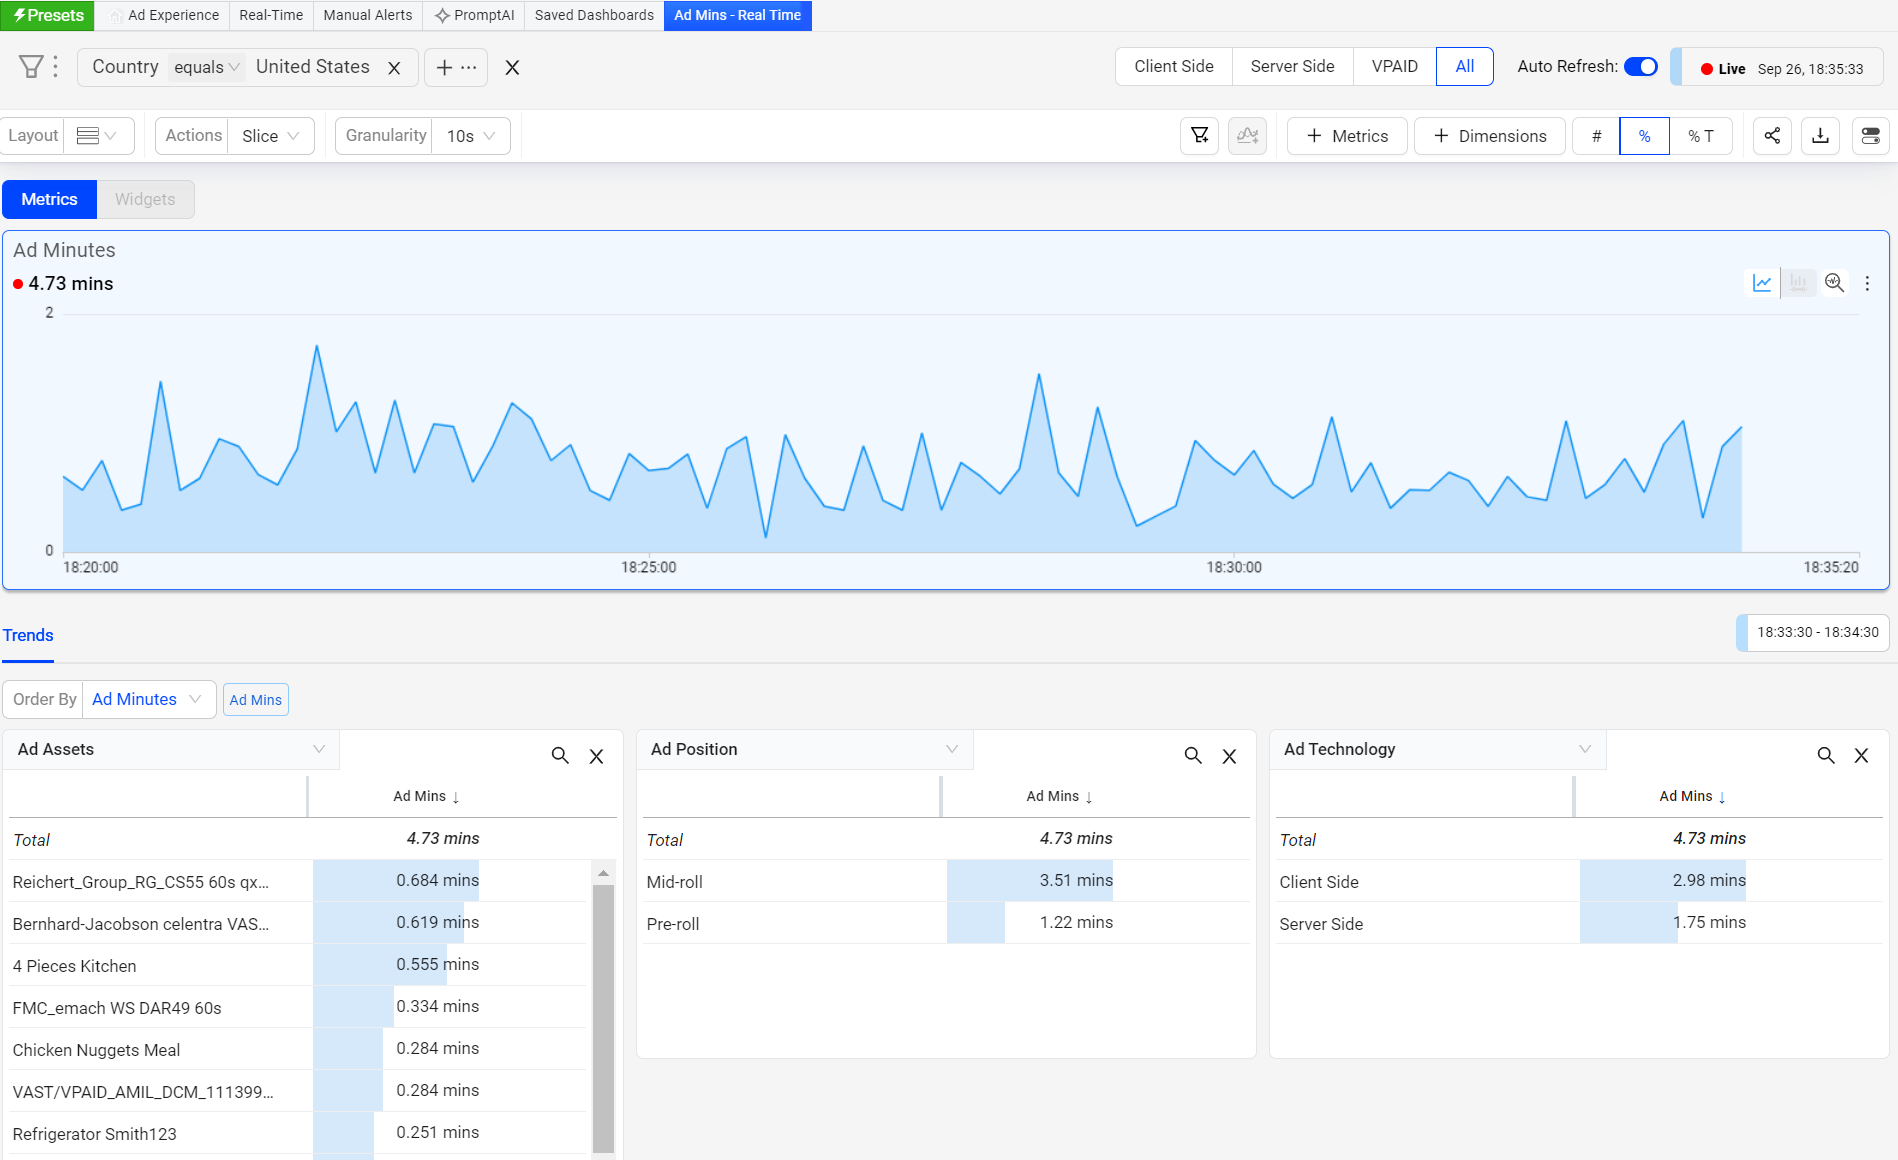
Click the metric cell to open the diagnostics page.
The diagnostic page with data for the impacted dimension and filter settings.
You can also click a column heading to override auto-sorting and sort data by that column in ascending and descending order.
Hover over a column heading and click the kebab icon to drag the column to a new location.![]()
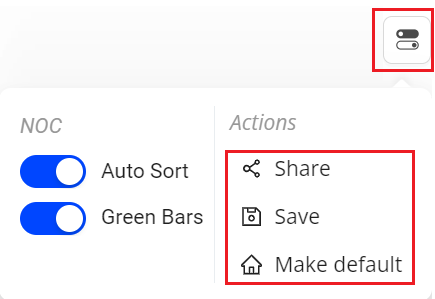
Click the Hamberger icon to re-enable auto-sorting.
![]()
You can turn on and off the green bars from the Hamberger icon.
![]()
You can also Share and Save the dashboard from the Hamberger icon.
After clicking Share, Video saves a snapshot of the item and produces a link you can share by email or paste it into another document.
When users open the link and log in to Conviva Ads, they see an exact copy of the item you sent. They can change how Conviva Ads presents the data in the snapshot but cannot change which data are part of the snapshot. For example, the user can deselect metrics to hide them, but they cannot change the dimension or time series.
You can save the Real-Time dashboard to reuse and collaborate the data and make this page your default page so it appears as the active page whenever Conviva Ads launches.
Ads Real Time Dashboard Ads Real Time Dashboard Ads Real Time Dashboard Thresholds Threshold crossing alerts Enable Auto Sort