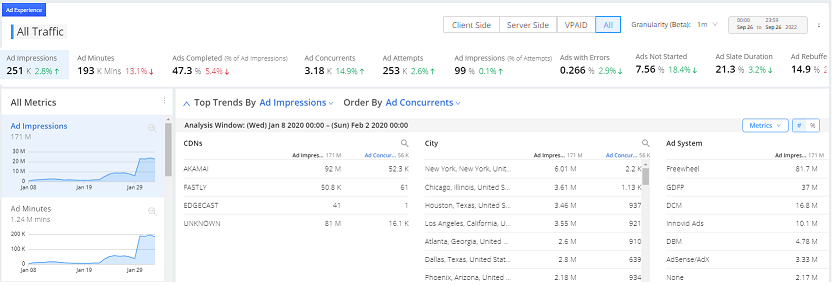
With Ads, audience and performance metrics are displayed for easy in-depth analysis and correlation. The metrics data and time series widgets display metric data with enhanced time period and granularity, down to 1-minute data intervals for up to 24 hours within the last 30 days.
Data Granularity
In addition to the enhanced time-picker selection, data granularity improvements support 1-minute data granularity for any 24-hour period within the last 30 days and hourly data for up to 13 months.
|
Previous Data Granularity |
New Data Granularity |
|---|---|
|
1-minute data intervals up to 6 hours. 5-minute data intervals up to 1 day. |
1-minute data intervals up to 24 hours, within the last 30 days. |
|
Hourly data intervals from 1 day to 7 days. |
Hourly data intervals up to 30 days within the last 13 months. |
|
Daily data intervals from 7 days to 30 days. |
Daily data intervals for greater than 30 days within the last 13 months. |
Data Accessibility
Using Ads, including the Diagnostics pages, metric data appears within 10 minutes or less for timely impact analysis.
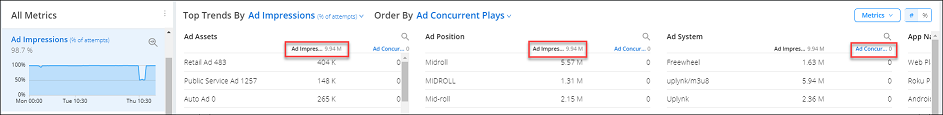
Enhanced Ad Impressions (% of Attempts) and Ad Attempts Analysis
To enhance the effectiveness of ad impression and attempted ad Analysis, Ads includes the Ad Impressions (% of Ad Attempts) metric. With this metric, ad impressions can be more clearly analyzed along with the percentage of all attempted ads associated with specific dimensions. The Ad Impressions metric now shows the number and percentage of all ad impressions associated with specific dimensions.
Analyzing the number and percentage of actual ad impressions alongside the attempted ads enables more detailed insights into which dimensions, such as ad server, players and ad creatives, were most impacted by delivery and performance issues that led to both successful and unsuccessful ad attempts.
For example, click the Ad Impressions metric in the summary list to change the Top Trends By and Order By metric to Ad Concurrent Plays. The Top Trends By metric determines the set of data to display for each dimension. The Order By Metric enables you to sort that data by different metric values.
When displaying multiple metrics, you can also click any of the highlighted metric names above the dimension values to sort the dimension values in ascending or descending order by that metric. For example, click the Plays metric to change the order the dimension values from Attempts to the number or percentage of Plays, in ascending or descending order.
Date and Time Intervals
Ads provides pre-defined time intervals along with a calendar based time-picker for custom intervals. The time-picker also supports a specific hour, and 5-minute ranges from 00:00 hour to 23:59 hour.

Click Time Frame settings and select a predefined range or use the time selector to choose the start and end dates/times for the desired time interval.